A New Field of Research
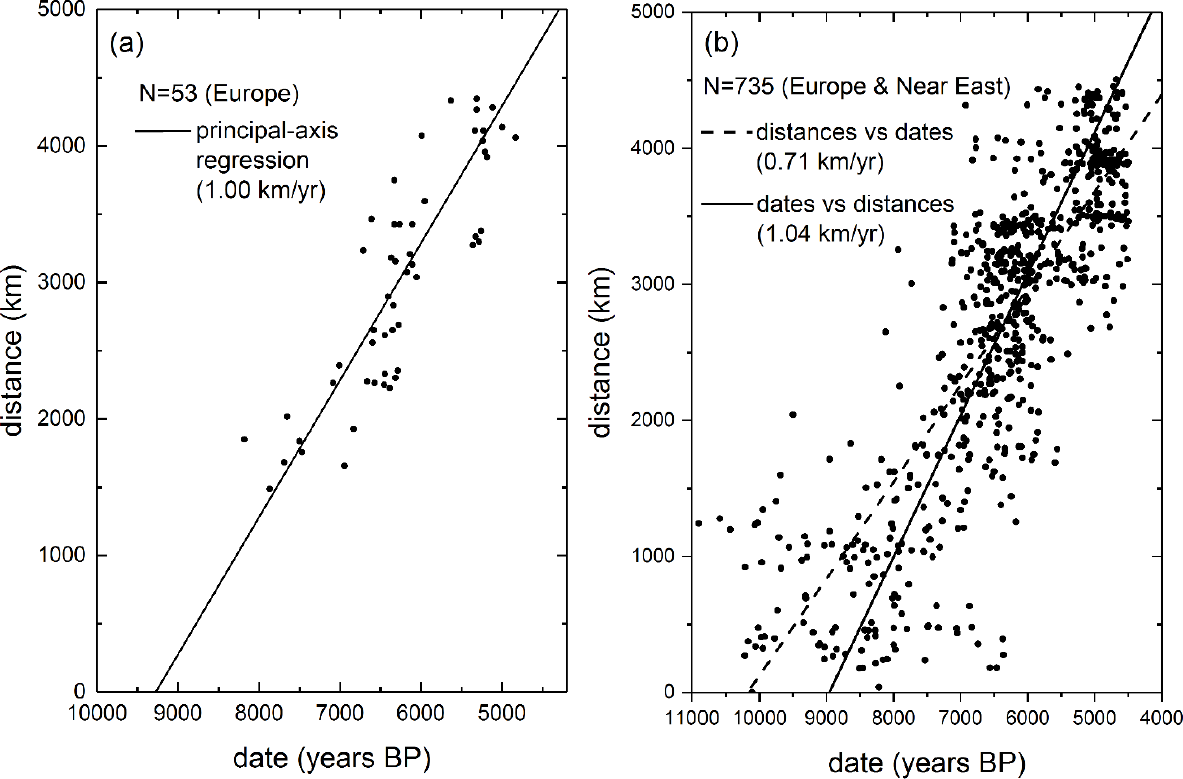
During his years as a researcher on bacterial genetics in Cambridge (1948–50), Cavalli-Sforza had envisaged the possibility of a totally new field of research that would relate human genes to prehistory [1]. His idea was that as human populations moved around the Earth, they split many times, so the genetic similarity between present groups could perhaps be used to infer the times and places of the main population movements in prehistory. He made a first attempt in the early 1960s, when he noted that Apulia (a region in the southeast of Italy) and the island of Sardinia have similar megalithic constructions. This similarity suggested that some population capable of constructing them had reached these regions (and other ones in Europe with megalithic monuments). Cavalli-Sforza and his co-workers took blood samples with the hope of finding genetic similarities between the present populations of both regions. However, they could not detect any such similarities [2]. Cavalli-Sforza reasoned that if megalithic populations from outside had arrived and constructed these monuments, they were probably small relative to the populations of farmers already established from long ago. This suggested that only movements of very large populations could perhaps have left genetic traces. Thus his next attempt was to analyze the transition to the Neolithic (farming and stockbreeding), because farmers have substantially higher population densities than the preceding hunting-gathering (Mesolithic) populations [2,3]. It was also known that there are older Neolithic sites in the Near East than in Europe [4,5], but no statistically rigorous analysis of this spread had been performed. At a conference in 1970 [6], Cavalli-Sforza met archaeologist Albert Ammerman, who since 1968 had been collecting early Neolithic dates in Europe [7]. A scant 53 dated sites were then available, since radiocarbon dating had only been developed about two decades before. They plotted the distance of each site from the site in the Near East that yielded the highest correlation coefficient, r, as a function of its date and fitted a straight line. The result is shown in Figure 1a. Their fit had a surprisingly high correlation (r = 0.89), suggesting that a constant spread rate was a fairly realistic description of the overall process. Using principal axis regression, they estimated a spread rate (slope) of about 1 km/yr (Figure 1a) [8]. They also considered the regressions of distances vs. dates and vice versa (not shown), which gave a range of 0.8–1.2 km/yr [9]. As mentioned above, these results were obtained using only n = 53 sites and published in 1971 [8]. Over the subsequent decades many other sites were dated, and several independent analyses confirmed the spread rate and high correlation estimated by Ammerman and Cavalli-Sforza [8]. For example, in 2005 a study based on 735 sites [10] yielded a similar range (0.7–1.1 km/yr) and correlation coefficient (r = 0.83). The corresponding fits are shown in Figure 1b.
Ammerman and Cavalli-Sforza went further. Also in year 1971, in a congress [12] and a meeting [13] they explored the implications of their spread rate (about 1 km/yr). Cavalli-Sforza knew that Fisher had developed a mathematical (reaction-diffusion) model [14] to describe the spread of an advantageous mutation, which is also useful to describe biological invasions [15]. According to this model, when a population expands its range, the spread rate (i.e., the speed of the population front) is:
which is measured in km/yr. D is the diffusion coefficient, which is defined below and measured in km2/yr and a is the initial growth rate in yr–1. This means that the population density, p, if small enough, increases with time t as p = p0eat. Ammerman and Cavalli-Sforza [13] used Equation (1) to estimate the dispersal distance moved by early farmers, in the following way. They applied Fisher’s model as originally formulated in one spatial dimension [14], so the diffusion coefficient is given by the one-dimensional expression [16] as:
where T is the generation time and Δ is the distance moved per individual and generation (for simplicity, we assume for the moment that all individuals move the same distance). Ammerman and Cavalli-Sforza used the spread rate s = 1 km/yr from Figure 1a, an initial growth rate of 3.9% (a = 0.039 yr–1) from ethnographic data of human populations that settled in empty space [17], and a generation time of T = 25 yr into Eqs. (1) and (2) and obtained Δ~18 km. In fact, in two dimensions the result is very similar because then Eq. (2) is replaced by [9]:
and the same procedure as above yields Δ~25 km. Cavalli-Sforza had previously analyzed the movements of individuals of modern and medieval populations using Italian parish books and his own fieldwork in Africa [12,18,19], so he knew that such values for the distance moved per generation Δ are similar to those implied by ethnographic data. This crucial insight has been sometimes overlooked but was very clearly explained by Cavalli-Sforza in a paper at a Genetics congress in year 1971 [12]: “A mathematical theory was put forward by R. A. Fisher (1937) … As to migration rates, those observed in today’s African farmers occupying the tropical forest give … 20 to 30 km. It is remarkable that, using these growth and migration rates, the expected radial rate comes very close to the observed rate” (i.e., 1 km/yr, as explained above). Thus the direct application of Fisher’s spread rate, Eq. (1), was one reason for the proposal by Ammerman and Cavalli-Sforza that the Neolithic spread was mainly due to the dispersal and reproduction of farmers from the Near East.
Cavalli-Sforza came up with the new term ‘demic diffusion’ [7] (from the Greek demos, which means people) to denote the geographic spread of a cultural trait (the Neolithic in this case) due to the dispersal and reproduction of people.
The proposal of demic Neolithic diffusion was a radical one at the time, because many archaeologists advocated for ‘cultural diffusion’, i.e., a scenario in which the Neolithic would have spread due to the learning by hunter-gatherers of agriculture from nearby farmers [20–25]. But Cavalli-Sforza reasoned that if cultural diffusion had been the main mechanism at work, it would have probably led to faster spread rates, s, similarly to the introduction of pottery and other cultural innovations that spread faster because they were substantially simpler to learn than farming and stockbreeding [26]; therefore, Fisher’s model would not have led to values of Δ in agreement with ethnographic data.
A second, more intuitive reason for Cavalli-Sforza to believe in the importance of demic diffusion was the strong resistance of hunter-gatherers to become farmers that he had observed in his expeditions to Africa [2,12,27]. A third reason was the existence of genetic clines, i.e., spatial variations in the frequency of a genetic marker in modern European populations with an extreme in the Near East, such as those of Rh- and HLA-B8 [2,11,26]. Finally, a fourth reason to introduce the hypothesis of demic diffusion was that Ammerman had noted, in his fieldwork in Italy since 1968, a lack of continuity in stone tools between the Mesolithic and the earliest Neolithic, and that almost none of the open-air settlements of early Neolithic age ever produced any evidence of the Mesolithic [28].
As mentioned above, clines centered in the Near East were observed for some (but not all) genetic makers. Thus, it was convenient to find a method to summarize the spatial variation of many genes. Cavalli-Sforza devoted two years of intense work with physicists Menozzi and Piazza to develop and apply such a method [11]. They discovered that the main pattern (first principal component) of protein gene frequencies in present Europeans has an extreme in the Near East, and published this major finding in the journal Science [29], defending that it supported the importance of demic diffusion during the Neolithic spread. Their conclusions agreed with those from maps obtained from HLA and non-HLA alleles separately. Sokal and Menozzi corroborated the existence of gradients without using principal components, by computing spatial correlograms for HLA data along the established paths of the spread of agriculture, and pointed out that such gradients were expected if demic diffusion had played a major role in the spread of the Neolithic [30]. Moreover, Sokal and co-workers reported in Nature significant correlations between origin-of-agriculture temporal distances (obtained from archaeological dates) and genetic distances, and argued that this also supported the relevance of demic diffusion [31,32]. The demic diffusion model of Neolithic spread became increasingly accepted among geneticists in the 1980s, and the consensus within the genetics community in the early 1990s was that demic diffusion had been important in the spread of the Neolithic in Europe. However, in the mid-1990s the first datasets of mitochondrial DNA (mtDNA) of modern populations appeared and very old ages were estimated for many mutations. This led some geneticists to propose that the clines might not have been formed during the Neolithic spread but much earlier, when the first modern humans spread into Europe, and therefore that the Neolithic spread had been essentially cultural [33–35]. Barbujani and co-workers defended demic diffusion against these attacks, pointing out that the age of a mutation can be older than that of the migration of individuals carrying the mutation considered [36–39]. Chikhi and his collaborators analyzed nuclear markers, for which they detected geographic clines [40,41], no evidence of population splits older than the spread of the Neolithic [42], and a westward decrease in their estimation of the proportion of Neolithic genes [43]. They argued that these results supported the importance of demic diffusion (see also refs. [36,44]). All of these findings were based on modern DNA.
As mentioned above, many archaeologists rejected from the start (and during four decades) the importance of demic diffusion in the spread of the Neolithic in Europe [21–25]. Indeed, in 2006 an archaeologist [25] still claimed that ‘there was a process of adoption of components of the Neolithic package by the indigenous foraging populations (…) The genetic data point to little genetic input from incomers at the time of the Neolithic [33,45]’. Ancient DNA (aDNA) was then available for early European farmers [45], but not hunter-gatherers. A substantial portion (about 25%) of early farmers displayed a mtDNA haplogroup (N1a) that is almost absent today in Europe, so in 2005 the authors of ref. [45] hypothesized that present Europeans did not descend mainly from early farmers, but from hunter-gatherers who had presumably become farmers through acculturation (cultural diffusion) [45]. Cavalli-Sforza cautioned that this conclusion was not justified [46]. He was shown to be right four years later, when DNA of European hunter-gatherers became available and it turned out that they were extremely different genetically from present Europeans, ruling out the possibility that the latter descend mainly from hunter-gatherers [47]. The implication for N1a was that its frequency decreased during the elapsed millennia until today. It was also noted that most hunter-gathers displayed U5 or U4 haplogroups (i.e., groups of alleles sharing one or more ancestral mutations), which were absent in early farmers, so the latter must have definitely come from other regions (demic diffusion) [47]. In this way, the importance of demic diffusion in the spread of the Neolithic across most of Europe finally became overwhelmingly accepted in the archaeological and genetics communities. This view had been repeatedly advocated by Cavalli-Sforza, as is clearly seen from the title of his 2002 work ‘Demic diffusion as the basic process of human expansions’ [26].
In order to avoid confusion, it is important to stress that Ammerman and Cavalli-Sforza repeatedly pointed out that, in addition to demic diffusion, cultural diffusion (interbreeding and/or acculturation) should have also taken place to some extent, and that the combination of cultural and demic diffusion would have led to genetic clines. A particularly intuitive explanation of this point can be found in pp. 82–84 of their 1984 book [11].
Unfortunately, some archaeologists [21,48] and geneticists [49] understood that Ammerman and Cavalli-Sforza were claiming that the Neolithic spread had been totally demic. One possible reason for this confusion may be that Fisher’s model, Eq. (1), is indeed totally demic. Ammerman and Cavalli-Sforza had to use Eq. (1) because no cultural-demic generalization of it was then available. For this reason, at the time it was reasonable to use Eq. (1) as an approximation. This point is much easier to explain today because Fisher’s equation has been generalized, for cases in which there is cultural in addition to demic diffusion, into (see Eq. (S11) in ref. [50])
where η is the intensity of cultural transmission. If we use the estimation η = 0.02 (as explained in detail in Sec. 3 below) and the values a = 0.032 yr-1, D = 15.44 km2/yr and T = 25 yr [9], this equation yields s = 1.42 km/yr, very close to the totally demic result s = 1.41 km/yr from Eq. (1). Thus Fisher’s model is indeed valid as a first approximation (more relevant corrections to it are discussed below).
A second important, sometimes overlooked point is that Cavalli-Sforza stressed that the genetic data that he analyzed from modern populations did not make it possible to conclusively quantify the relative importance of demic and cultural diffusion in the spread of the Neolithic in Europe. He did not change his view on this issue, as is very clear from the following text published in year 2002 [26]: “The variance of the first principal component estimate of the Neolithic contribution to Europe is 26–28% [27,29]. Other more recent estimates of the Middle Eastern Neolithic contribution to Europe include those from mtDNA, stated to be 20% [51], and those from the Y chromosome that give a similar estimate (20%) [52]. It seems cautious to think that the data available are still too few and not sufficiently representative … My view is that we do not yet have really good estimates. I would not be surprised if the contribution of the demic diffusion tied with agriculture should turn out to be greater than 20%. It happens that, with the help of a new method, more advanced than earlier ones, Chikhi et al. [43] have just reached the conclusion that the contribution of mid-eastern farmers to Europe is not far from 50%. There are many potential sources of error in the analysis of this problem. We will need better data …”.
A third confusion is that some archaeologists understood that Ammerman and Cavalli-Sforza had advocated for a uniform spread rate over all of Europe [21,22,53], in spite of the fact that already in their first publication they included a list of regions where the spread was faster or slower than average [8].
Ammerman and Cavalli-Sforza presented a more detailed analysis of their demic wave of advance model, based on Eq. (1), in the 1984 book [11]. Here they used dispersal distances (and therefore, values of the diffusion coefficient) from ethnographic data. Their purpose was to check that they could indeed obtain a spread rate of about 1 km/yr, by using only data estimated from independent observations (i.e., without adjusting any parameter value to obtain a spread rate of about 1 km/yr, as they had done in 1973 with the value Δ~18 km discussed above). They used histograms of several populations. Each histogram is a set of dispersal distances Δi moved per generation and their corresponding probabilities, pi. Then the two-dimensional Equation (3) is generalized into [9]
where is the mean-squared displacement per generation. In their 1984 book, Ammerman and Cavalli-Sforza applied the approximation
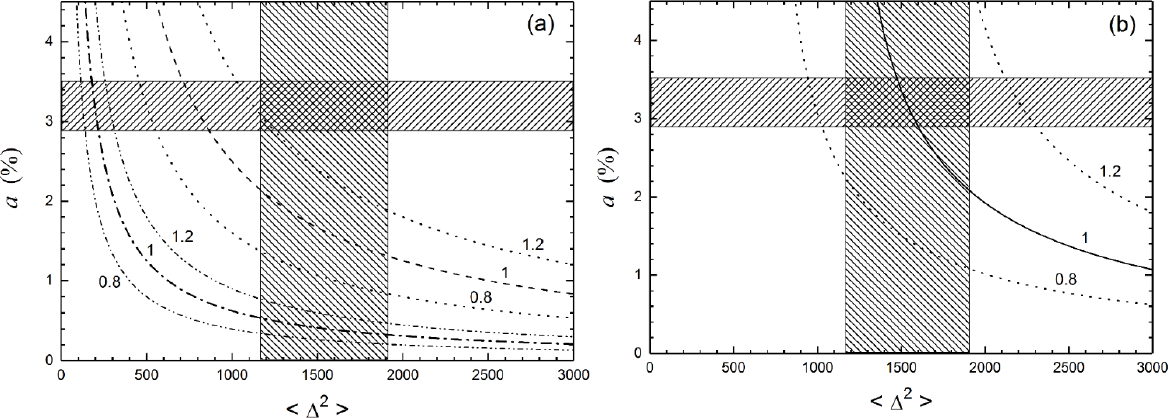
and they plotted (Figure 5.9 in ref. [11]) the three lower curves that we reproduce in Figure 2a. Thus, for each value of the spread rate (0.8, 1.0 and 1.2 km/yr in Figure 2a), a curve gives the pairs of values of a and <Δ2> that agree with the spread rate considered according to Eqs. (1) and (6), using again a generation time of T = 25 yr. The intuitive meaning of Figure 2a is that for a given spread rate (e.g., the lower line for 1 km/yr), if the growth rate a is smaller, then larger dispersal distances <Δ2> of the population are needed (and vice versa) to attain the spread rate considered. The hatched rectangles in Figure 2a give the ranges of parameters a and <Δ2> estimated from ethnographic data of pre-industrial farmers [9]. The three upper curves in Figure 2a use the two-dimensional Eq. (5) instead of the approximation (6). Obviously this leads to a slower spread rate (Eq. (1)), so for given values of s and <Δ2> the necessary value of a (for a given rate) is higher, and this is why the three curves for Eq. (5) are above those for Eq. (6) in Figure 2a. The curves for the two-dimensional Eq. (5) are marginally consistent with the measured spread rate (0.8–1.2 km/yr) from Figure 1a. An example of the influence of the work by Ammerman and Cavalli-Sforza on later research is shown in Figure 2b. It was obtained by refining Fisher’s model to take into account that newborn humans (farmers in this case) live some time with their parents, and this further slows down the spread rate given by Eq. (1) according to [9]
The full lines in Figure 2b take this into account, because they have been obtained by using Eq. (7) and (5). It is seen that they agree quite well with the ethnographic data (central rectangle), so the wave-of-advance model is able to explain the average measured spread rate of the Neolithic in Europe.
An alternative way to grasp the difference between Eqs. (1) and (7) is that, as seen above, for the values a = 0.032 yr–1, D = 15.44 km2/yr and T = 25 yr [9], Eq. (1) yields a spread rate of s = 1.4 km/yr. In contrast, Eq. (7) yields s = 1.0 km/yr, which agrees better with the observed rate for the spread of the Neolithic in Europe (0.8–1.2 km/yr, according to Figure 1a). More accurate equations than (7) have been found but they are substantially more complicated [54,109] and it is not necessary to reproduce them here explicitly.
I once asked Cavalli-Sforza if the wave-of-advance model of Neolithic spread had been his idea, and his answer was affirmative (his literal words were “as far as I know”). Cavalli-Sforza wrote [55,56] that he had learned about Fisher’s model [14] by perusing Fisher’s papers during the two years that he had spent with Fisher in Cambridge (1948–1950). In 1973, more than twenty years later [13], Cavalli-Sforza recalled and applied to Neolithic spread the theoretical model in Fisher’s 1937 paper [14], which dealt with a purely genetic issue and already contained the expression ‘wave of advance’ in its title. Cavalli-Sforza also found it useful [55] that in 1951, Skellman had applied Fisher’s paper to a biological invasion [15], and this early application was carefully reviewed in the book written by Ammerman and Cavalli-Sforza in 1984 [11].
My guess is that if Cavalli-Sforza had not worked on this topic, the following sequence of events would have likely happened. (i) During the 1970s or 1980s, some archaeologist would have probably measured the spread rate of the Neolithic in Europe. (ii) More time would have been necessary for someone to realize that Fisher’s wave of advance model could be applied to the spread of the Neolithic in Europe. It is difficult but possible that somebody, e.g., an ecologist interested in archaeology, would have done this during the 1990s or 2000s, but only if he had been familiar with both Skellman’s 1951 paper and the Neolithic measured spread rate. (iii) Even today, perhaps nobody could have estimated the necessary parameter values (reproduction rate, generation time and dispersal distances per generation) from totally independent data to calculate Fisher’s spread rate and compare to the observed value. This was indeed an impressive contribution, and the source of much subsequent work (as reviewed in the next section). In my opinion, very few researchers (if any) besides Cavalli-Sforza had the statistical training and interest in prehistory necessary to perform step (i), the knowledge on both reaction-diffusion partial differential equations [14,15] and Neolithic spread needed to make step (ii), and the research experience in human dispersal behavior [18,19] which, combined with his extraordinary intelligence, allowed him to carry out step (iii). Cavalli-Sforza covered all of these steps in about one year, in collaboration with archaeologist Albert Ammerman (after meeting each other at a conference in the summer of 1970 [6], they begun working together during a visit of Ammerman to Pavia in November of 1970 [7] and reported the measurement of the spread rate in an article published in 1971 [8] and the subsequent application of Fisher’s Eq. (1) at a congress in September 1971 [12] and a meeting in December 1971 [13]). This opened a totally new field of research that amazingly joined science and the humanities.
Cavalli-Sforza had interest in many prehistoric spread rates, not only in the European Neolithic. This is very clear from the enthusiasm that he showed with these words [57]: “I have under my eyes an interesting paper (…) The main interest is that it is the only Paleolithic rate that I know”. These words led to the first statistically sound measurement of a Paleolithic spread rate [58]. Cavalli-Sforza was also very interested in the possibility of measuring the rates of the Neolithic spread in Austronesia, the Bantu expansion, as well as cultural expansions in hunter-gatherers (he suggested the bow-and-arrow as a very interesting possibility, but unfortunately, we could not find appropriate data to map its spread). His last scientific paper was a review on the out-of-Africa expansion of modern humans [59]. For this case study, unfortunately the archaeological data available today are still not sufficient to perform reliable estimations of the spread rate [60–62,98] but other interesting questions can be tackled. Numerical simulations of the range expansion have been performed by archaeologists, who have analyzed the possible gradual loss of cultural diversity due to drift effects [63]. Cavalli-Sforza and other researchers showed that present genetic diversity decreases linearly with increasing geographic distance from Africa, and they also detected a very high correlation between genetic and geographic distance (in both cases with r ≈ 0.9) [64]. They attributed both linear relationships to repeated drift effects, due to small pioneering population sizes during the out-of-Africa expansion (Cavalli-Sforza introduced the term ‘serial founder effect’ to describe such a process) [64]. Also in his last scientific paper, Cavalli-Sforza and colleagues stressed [59] that the loss of phonemic diversity observed in a worldwide sample of present human languages with increasing distance from Africa [65] could be due to the same serial founder effect. The linguistic processes needed for this proposal to explain the observed phonemic data have been constrained by using wave-of-advance numerical simulations of the out-of-Africa expansion [66,67].
It is worth mentioning that the importance of Neolithic transitions to understanding genetic patterns is not limited to humans. Indeed, simulations taking into account possible consequences of Neolithic spread phenomena on other species have been performed to infer possible scenarios that can explain the observed genetic patterns of European domesticated goats [68] and other domesticated species in several continents [69].
Spread Rates of Human Range Expansions and Related Topics
Let us emphasize that Ammerman and Cavalli-Sforza believed in the importance of demic diffusion, but they stated that cultural diffusion also took place. Indeed, already in 1971 they pointed out that the combination of demic and cultural diffusion would have led to genetic clines [8]. On the other hand, Cavalli-Sforza and Feldman [70] carefully distinguished three types of cultural diffusion: vertical, horizontal and oblique. In Neolithic transitions, vertical transmission is interbreeding between farmers and hunter-gatherers. The second type, horizontal transmission, refers to acculturation by farmers of hunter-gatherers of the same generation (who therefore convert into farmers). Finally, oblique transmission describes acculturation by farmers of hunter-gatherers of the preceding generation, and it leads to the fastest spread rates [71].
It was known since 1971 that the observed rate of the Neolithic spread in Europe (Figure 1) agreed with that predicted by Cavalli-Sforza’s demic wave-of-advance model (Figure 2) [12,13]. In contrast, no model based on cultural diffusion has been proposed that can explain the observed rate (about 1 km/yr) using parameter values obtained exclusively from independent observations (i.e., without adjusting any parameter value) [10].
Ammerman and Cavalli-Sforza applied Fisher’s model [12,13]. We emphasize that it is purely demic, i.e., it does not include cultural transmission. Forty years later [50,72], a refined demic model [54] was combined with the mathematical theory of cultural transmission due to Cavalli-Sforza and Feldman [70]. The resulting demic-cultural model has a crucial parameter η that is called the intensity of cultural transmission. For vertical transmission [72], this parameter η is defined as the portion of pioneering farmers that interbreed with hunter-gatherers [73]. For horizontal transmission, η is defined as the number of hunter-gatherers converted into farmers by each pioneering farmer per generation [50]. If there is both vertical and horizontal transmission, then η is the sum of both contributions, i.e., η = ηv + ηh, where the subscripts denote vertical and horizontal transmission. The oblique case is more complicated to handle mathematically (because it involves interactions between different age groups of the two populations) [71], so for simplicity we will not include it here.
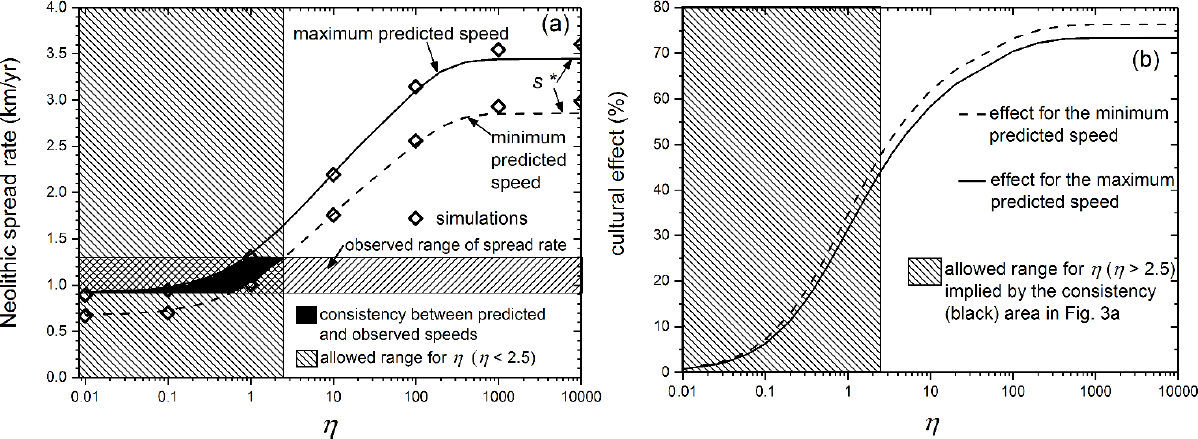
The demic-cultural model [50,72] yields an equation according to which the spread rate increases for increasing values of η. We have already seen a very simple equation of this type, namely Eq. (4). Figure 3a is based on a more precise equation [50] that uses the complete dispersal histogram (instead of the diffusion coefficient D, which provides a less detailed description). In Figure 3a, the two curves are the maximum and minimum spread rates obtained for ethnographically realistic ranges of the initial growth rate a and generation time T, as well as a dispersal histogram recorded for pre-industrial farmers in ethnographic fieldwork [12,19]. We see in Figure 3a that for the observed spread rate (horizontal rectangle) to agree with that expected from the model (area between the two curves), it is necessary that η ≤ 2.5 (so only the range of η in the hatched area at the left of Figure 3a and Figure 3b is allowed, namely, 0 ≤ η ≤ 2.5). This implies that ≤ 2.5 hunter-gatherers were converted into farmers by each pioneering farmer and generation (without interbreeding, i.e., ηv = 0), or equivalently that ≤ 1.5 hunter-gatherers were converted into farmers by each pioneering farmer and generation (for complete interbreeding, i.e., ηv = 1).
The effect of demic diffusion on the spread rate is defined as [50]
where s is the spread rate (for the value of η considered) and sη=0 is the spread rate for purely demic diffusion (η = 0). The effect of cultural diffusion on the spread rate is defined as [50]
Note that the sum of the demic and cultural effects is always 100%. The cultural effect (9) is plotted in Figure 3b, simply by using the two curves in Figure 3a and Eq. (9). We have seen from Eq. (8) that the maximum possible value of η (from Figure 3a) is η =2.5. In Figure 3b, the intersection of the vertical line corresponding to the value η = 2.5 (right-hand side of the hatched rectangle) with the dashed curve implies that the maximum cultural effect was 48%. Thus the allowed range for η (hatched area at the left of Figure 3b) implies that the cultural effect (9) was between 0% and 48%, i.e., that the demic effect (8) was 52%–100%. This is necessarily higher than 50%, so the conclusion is that demic diffusion had been more important than cultural diffusion in the spread of the Neolithic in Europe [50]. Other dispersal histograms measured for pre-industrial farmers yield still higher ranges of the demic effect (e.g., 70%–100% for the population considered in Figure S1 from ref. [50]).
In the explanation above, we have estimated a minimum percentage of demic diffusion (52%). In principle it is also possible to estimate a maximum percentage [50] but this requires knowing the lower bound of the intensity of cultural transmission η and the ethnographic data from modern populations may not be appropriate, so it is better to use genetic clines instead (see Section 3 below).
The work by Ammerman and Cavalli-Sforza analyzing archaeological data [8,11,13] has led to many further analyses and applications. Gkiasta and co-workers [74] assembled a database of 510 sites, repeated the major-axis regression and found a spread rate of about 1.3 km/yr and r = 0.73 (similarly to the results in Figures 1a–b). A different approach was followed by Bocquet-Appel and co-workers, who used geostatistical techniques to estimate the spread rate of several Neolithic cultures of Europe and also found a similar result for the average rate over all of Europe (excluding marine areas), namely 1.1 km/yr [75].
Recently Porcic and co-workers estimated a spread rate for the Neolithic in the central Balkans of 1.6 km/yr using principal-axis regression (the correlation coefficient was remarkably high, r = 0.81, given that the maximum distances involved were only about 650 km) [76].
Gkiasta et al. produced an isochron map in which a slowdown of the Neolithic wave of advance in alpine regions showed up clearly [74]. This confirmed the existence of a significant slowdown in the Alps, which had been detected in another interpolation map (based only on 62 sites) published in the 1984 book by Ammerman and Cavalli-Sforza [11]. The same slowdown was also displayed with high resolution in an interpolation map based on 918 sites [77]. In Northern Europe, another very clear slowdown was observed [11] and its possible causes included competition for space [78,79], cultural diffusion [77] and climate effects [80].
The effect of waterways on the spread of the Neolithic was analyzed by the group led by A. Shukurov, who estimated spread rates along several coasts and rivers [81] and generalized the mathematical wave-of-advance model to include non-isotropic dispersal [82].
Non-isotropic dispersal has been also proposed as a possible explanation for the fastness of the Khoi-khoi expansion of herders in southern Africa which took place 2,300–1,100 years before the present (BP) at a rate of 1.4–3.3 km/yr and the Bantu expansion of farmers in southeastern Africa which spread at 1.5–2.3 km/yr in the period 3,400-1,400 yr BP [83].
Already in 1971, Ammerman and Cavalli-Sforza had observed that the spread rate of the European Neolithic was faster along the western Mediterranean coast than inland [8]. During the following decades, the number and reliability of dates in that region increased. A particularly important source of error turned out to be the so-called old wood effect, which is due to the fact that only the outer rings of trees are alive and, therefore, samples of wood or charcoal can lead to erroneously old dates if they correspond to inner rings. For example, at the site of la Draga (Catalonia) the wood of an oak pillar was dated 450 years earlier than some cereal seeds [84]. By taking these and other sources of error into account, Zilhao selected only the most reliable dates in the western Mediterranean and observed that the spread rate was extremely fast [84], although a quantitative estimation was not yet possible [85]. Recently enough data have become available for this purpose, and the result is about 8.7 km/yr, which, combined with simulations based on the wave-of-advance model, implies movements of about 350–450 km per generation along the western Mediterranean coast [86]. Assuming a generation time of 25 years, the rate is 8.7 km/yr = 218 km/gen. This is less than 350 km/gen because the latter value could be attained only if reproduction were extremely fast (this is a well-known property of reaction-dispersal equations; see p. 35 in ref. [87]). The estimation of movements with lengths of 350–450 km per generation is based only on data along the western Mediterranean coast of Europe, so it is more precise than previous estimates using data from all of Europe, which already indicated that the dispersal distances per generation along the coast had been longer than inland [88].
Baggaley and co-workers [89,90] applied Bayesian inference techniques to provide improved estimates for several spread rates of the Neolithic in Europe, namely the background spread rate (which corresponds roughly to the average speed of about 1 km/yr found by Ammerman and Cavalli-Sforza [8,11]) and additional coastal and river spread rates (these are relatively small, the coastal one probably because they considered the northern Mediterranean coast as a whole, whereas the fast rate noted by Zilhao refers only to the western coast [84]).
Gagal and co-workers estimated an average spread rate of 0.67 km/yr (r = 0.87) for the Neolithic from the Near East across southern Asia, up to the Indus Valley, and suggested that it is slower than in Europe (~1.0 km/yr) because of the arid climate and complicated topography [91].
Recently de Souza et al. [92] fitted the values of six parameters to simulate expansions of forest agriculture in tropical South America and argued that two of them could be successfully modelled as demic waves of advance with realistic parameter values. These are the Saladoid-Barrancoid and the Incised-Punctuate expansions, with average spread rates about 1.3 km/yr (r = 0.86) and 1.9 km/yr (r = 0.91), respectively (but the corresponding error ranges are substantial, due to the paucity of adequate data) [92]. Very recently they have analyzed the roles of tropical moist forests on the spread of the Tupi (one of the largest language families in South America) using archaeological data and, in spite of the uncertainties (a few sites are about 3,000 yr older than the rest), they find that the results from the simulations improve substantially if the land cover is assumed to influence human dispersal [93].
Bernabeu and his collaborators simulated the spread of the Neolithic in Iberia under several models (with and without dispersal to non-adjacent grid cells, with and without taking into account the suitability of each cell for wheat farming, etc.) and compared to several archaeological databases (the oldest date per site, the most reliable date per site, etc.). They concluded that the models that fit the empirical data best are those in which farmers do not always jump to the nearest cells and those in which farmers prefer highest-quality land [94]. They also found that the most reliable databases agreed better with the simulations, so that the quality of the radiocarbon samples needed to be considered [95]. They compared simulations to data using the correlation coefficient of the linear fit between simulated and observed dates. It would be of interest to consider also the sum of the squares of the differences between simulated and observed dates.
Conolly et al. [96] found a decrease in the diversity of cereals and pulses in central Europe compared with southeastern Europe. Spatial simulations based on the wave-of-advance model have shown that drift can explain the observed decrease [97]. Other possible explanations include climate [80,96] and cultural [96] effects.
By comparing Neolithic spread rates in several regions of the world, I have proposed some laws [98]. With all of the information available at present (as reviewed above), these laws can be presented and extended (with a sixth law) as follows:
First law. The Neolithic spread inland at a rate of about 1 km/yr, but there was substantial variation (0.44-3.6 km/yr). At least the following 13 case studies now support the validity of this law. It is clearly satisfied for the spread of the Neolithic in Europe [8,10,11], across southern Asia [91], in the Balkans [75,76] and three ceramic culture areas, namely the Eastern Linear Pottery [75], the LinearBandKermanik [75] and the Trichterbeckerkultur [75], as well as for the eastern Bantu expansion in Africa [99], the spread of domesticated rice in China and southeastern Asia [100], and the Saladoid-Barrancoid and Incised-Punctuate expansions in tropical South America [92]. In my view, the spread of the Neolithic in Scandinavia [101], the southern Bantu spread [99] and the expansion of Khoi-khoi herders [102] also support this law, because there is no inconsistency with the facts that: (i) the last two case studies also agree with the second law below; and (ii) the Scandinavian one also supports the fifth law below. We stress that the first law does not apply to modern populations (e.g., the spread of farmers across the United States during the 19th century [103]).
Second law. When in addition to demic diffusion there is substantial cultural diffusion, Neolithic spread rates are faster. This law has strong support from mathematical models [50,71,72]. Moreover, it is consistent with the measured rates of two expansions for which cultural diffusion has been proposed to be of importance, namely those of Khoi-khoi herders in southern Africa [102] and the southern Bantu spread in East Africa [99]. For both case studies, the lower bounds (1.2 km/yr and 1.3 km/yr, respectively) are close to 1 km/yr, so they also support the first law.
Third law. Neolithic spread rates over the sea take place at about 10 km/yr. Clear examples are the spread of the Neolithic across the western Mediterranean [86] and Austronesia [104].
Fourth law. Most inland and coastal Neolithic spreads were mainly demic. The only examples known up to now that might have been mainly cultural was the spread of maize in America [105] and the expansion of Khoi-khoi herders in southern Africa [102]. In fact, in the latter case most of the range for the cultural effect (3%–68%) was below 50%, i.e., mainly demic (Figure 2.5 in ref. [98]). In any case, the fourth law is valid for all 13 case studies of farmers listed in the first law, as well as for the coastal spread of the Neolithic along the western Mediterranean [98].
Fifth law. Neolithic spread rates tend to become slower at higher latitudes. This was suggested by a quantitative study on the spread of the Neolithic in Scandinavia and was attributed to small growth rates (which were estimated directly from archaeological data) [101]. This observation is perhaps not surprising, given the fact that in modern human populations reproduction is known to decrease with increasing latitude [106]. The upper bound for Scandinavia (0.84 km/yr) was close to 1 km/yr, which also supports the first law. Another case study that clearly supports the fifth law is the well-known slowdown in northern Europe (see Sec. 2).
Sixth law. The Neolithic spreads later and more slowly at higher altitudes above sea level (compared to surrounding regions). A spatial interpolation of early Neolithic dates in Europe has made it possible to map the isochrones every 250 years and this has shown that the Neolithic first surrounded the Alps completely, and only later begun to climb up these mountains (Fig. 1 in ref. [77]). It did so from all directions (Fig. 2 in ref. [77]) and at clearly slower rates (Figs. 1 and 3 in ref. [77]).
The wave-of-advance model has been also applied to expansions of hunter-gatherers, including the post-glacial recolonization of Europe from southern refuges [58], the diffusion of the Clovis culture in North America [61,107], the early human occupation of southern South America [61,108], the peopling of Australia [148] and the out-of-Africa expansion [60-62] but, as mentioned in Section 1, for hunter-gatherers the paucity of data available at present leads to less precise results than for expansions of farmers.
Numerous mathematical modifications and extensions of Cavalli-Sforza’s wave-of-advance model have been reported. Steele reviewed such work and its comparison to the archaeological record [61]. As mentioned in Section 1, a mathematical refinement took into account the number of dimensions (Eq. (3) and Figure 2a). Another refinement took into account the delay time during which newborn humans live with their parents (Eq. (7) and Figure 2b). A third improvement uses, instead of the diffusion coefficient, the complete set of distances Δi and probabilities pi (moved by farmers per generation), besides taking into account mathematically the cohabitation between children and their parents [54,109].
Many mathematical extensions of Cavalli-Sforza’s wave-of-advance model take into account several populations, not only those of early farmers. Models with two populations (farmers and hunter-gatherers) are useful for analyzing the effect of interbreeding and/or acculturation on the spread rate [50]. Models with at three populations [73] or more [110] (such as hunter-gatherers, farmers with a given genetic marker, and farmers without it) are necessary to describe genetic clines (see Section 3 below).
Aoki et al. [111] proposed a three-population model that was generalized and applied by Patterson et al. [112] to the spread of the Neolithic in India. Motivated by ancient DNA results, in a recent paper Aoki [113] has added new terms to the original equations [111], obtaining a set of equations that has solutions with two crucial properties: (i) Neolithic technologies are introduced into Europe by expanding farmers of Anatolian origin rather than hunter-gatherers converted to farming and (ii) hunter-gatherers continue to coexist in Europe with incoming farmers.
Ackland and co-workers developed a three-population model that displays ‘cultural boundaries’ in which a population trait (language, ceramics, a genetic marker, etc.) does not extend because farming is thereafter no longer carried out by the invading population (Neolithics) but by an indigenous one (Mesolithics who have become farmers) [114]. They proposed that this model could account for the western boundary of the linear pottery culture (LBK) in Europe. It is well-known, however, that LBK farmers preferred to settle in loess soils [115,116], which suggests that the location of the LBK boundary was affected by non-homogeneities in the suitability of the land for farming [116]. In the model by Ackland et al. the cultural boundary forms even in homogeneous space [87], so its location is not due only to non-homogeneities such as the presence or absence of loess. According to Figure 2E by Ackland et al. [114] farming in all of Germany, Denmark, Italy, France and Spain would have been introduced by hunter-gatherers converted into farming and their descendants, which is opposite to the genetic replacement that has been observed using ancient genetic data in all of these regions [47,117–120] (although it is possible that in some specific locations, a substantial portion of hunter-gatherers transformed into farmers).
It has been pointed out [87] that it would be very important to justify the hypothetical interaction terms introduced by Ackland et al. [114] in their equations using independent observations or analytical derivations, because those terms are crucial to obtain their conclusions. This also applies to the models by Aoki and co-workers [111,113].
Genetic Clines
In 2001, Cavalli-Sforza spent some days in Girona and suggested that genetic clines would be an interesting topic of research. He had published several contributions on clines of individual markers [52,110,121] and had also included very clear discussions about them in his 1984 book with Ammerman [11] (intuitively in pp. 82–84 and using simulations in pp. 126–130). Moreover, he and his co-workers had performed principal component analyses of many genetic markers [29,110], as mentioned above and reviewed by G. Barbujani in a separate paper of this issue [122]. Here we focus only on the analysis of individual clines, a topic that has been sometimes overlooked but is again of interest today [73].
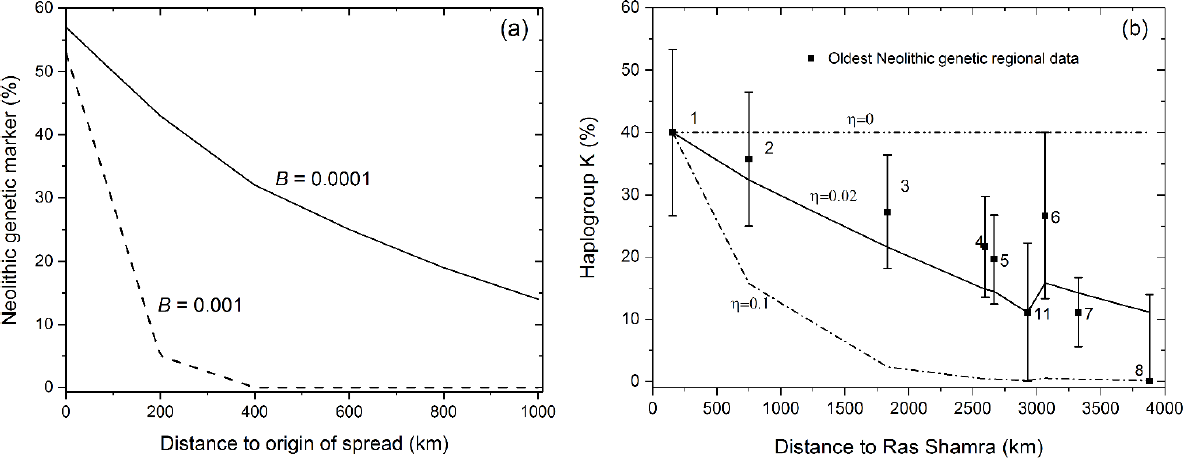
I believe that Cavalli-Sforza would have enjoyed analyzing ancient clines of individual genetic markers. This can be done by means of three steps. (i) to simulate the genetic evolution of Neolithic farmers as they spread and interbred with Mesolithic hunter-gatherers; (ii) to use these simulations to compute the percentage of a genetic marker in farmers as a function of the distance from the Near East (i.e., a genetic cline); and (iii) to compare this simulated cline to observed data. The first two steps were made by Sgaramella-Zonta and Cavalli-Sforza 48 years ago [121]. An example of their results is shown in Figure 4a. This figure shows the simulated cline on a two-dimensional lattice of 11 × 11 square cells (200 × 200 km2 each). Farmers disperse from the central cell of the lattice. Without interaction with hunter-gatherers, there is no cline (i.e., the line would be horizontal for B = 0). The larger the value of the interaction parameter, B, the larger and more important is the effect and the steeper the cline. Concerning the comparison to observed data (step (iii) above), Cavalli-Sforza and co-workers in year 2000 plotted observed clines of modern DNA separately for Mediterranean and central European populations (Figure 2 in ref. [52]). Unfortunately those observed clines could not be compared to simulations because population movements and other processes after the Neolithic (with unknown effects) have surely changed the shape of genetic clines, and also because the initial conditions were totally unknown, as explained below. Cavalli-Sforza and I discussed this topic again in Stanford in 2005, but the main problem was still that there were no ancient genetic data to compare to the results of simulations. Still worse, this lack of ancient genetic data implied that the initial conditions (genetic frequencies of hunter-gathers and Near Eastern farmers), which are necessary to find results from any simulation, were totally unknown at the time.
The paper by Sgaramella-Zonta and Cavalli-Sforza [121] was followed by other simulations of genetic clines. Rendine and co-workers [110] developed numerical simulations on a real map of Europe by assuming several population range expansions (not only the Neolithic one) and a set of genetic markers with different initial distributions. They used the simulations to compute principal component maps, related the latter to the presumed expansions, and compared these maps to the principal component maps previously obtained from modern genetic data [29]. One of these simulated maps had an extreme in the Near East, and therefore defended that the Neolithic expansion can be identified using principal components [110] (for the reactions of other researchers to this result, see Section 4). They also pointed out [110] that similar pattern had been found from genetic data of modern populations [29].
Barbujani and co-workers obtained genetic clines, again on a real map of Europe, by computer simulation under five different models or scenarios [123]. They showed that the continent-wide clines observed in modern genetic data cannot be explained by the model called ‘isolation by distance’, a scenario in which there is neither spreading of farmers nor interaction with hunter-gatherers [37,123].
Cavalli-Sforza and his group [124], as well as Currat and co-workers [125,126], modelled the occurrence of mutations and analyzed the phenomenon of ‘surfing’, rare genetic markers that increase their frequency at the leading edge (pioneering settlements) of a population front (see also ref. [123] and the Editorial of this issue by Chikhi and Barbujani). In ref. [126], two range expansions in Europe were simulated, namely those of modern humans (Paleolithic) and farmers (Neolithic). It was observed that mutations occurring at a front often lead to continent-wide clines for Paleolithic populations, but not for Neolithic ones (due to their higher carrying capacities). This work [126] and the relevance of the surfing phenomenon are further discussed below.
As explained in Section 1, in 2009 ancient genetic data of both early farmers and hunter-gatherers finally became available [47] making it possible to identify which mtDNA haplogroups were present in farmers and absent in hunter-gatherers. In 2017, the data were sufficient to compute percentages of the haplogroups in early farmers with reasonable error bars. They were compared to simulations, and the main results are shown in Figure 4b [73]. It is analogous to Figure 4a, but it includes ancient genetic data (squares and error bars) besides the results of simulations (lines) run on a grid of 180 x 102 square cells (50 x 50 km2) representing a map of Europe. Figure 4b uses parameter η rather than B (Figure 4a) because Figure 4b is based on cultural transmission theory [50,73], whereas Figure 4a is based on Lotka-Volterra equations [121]. Analogous to Figure 4a, for the model in Figure 4b there is no cline without interaction between farmers and hunter-gatherers (i.e., the line is horizontal for η = 0). For larger values of the interaction parameter (η in Figure 4b), the cline is steeper (also as in Figure 4a).
In Figure 4b, the minimum frequency in region 11 (Sweden) is observed both in the data and in the simulations. This minimum is due to the existence of two main routes for the spread of the Neolithic in Europe, namely an inland route through the Balkans and central Europe (regions 3–5) and a sea route along the northern Mediterranean coast (regions 6–8). The latter was faster, which implies longer dispersal distances per generation and a less steep genetic cline than along the inland route [73], resulting in the minimum in Figure 4b (both in the data and in the simulations).
In Figure 4b, we see that the simulations agree with all error bars if η = 0.02. By comparison with simulations using other values of η (not shown in Figure 4b), as well as taking into account the uncertainty in the initial genetic conditions (error bar 1 in Figure 4b), it was estimated that η = 0.01–0.03. According to the definitions of η (Section 2), this means that only between 1% and 3% of farmers were involved in interbreeding and/or acculturation with hunter-gatherers [73]. Therefore, in this sense demic diffusion was much more important than cultural diffusion. It is remarkable that this range (1%–3%) overlaps with a very recent one (2%–6%) obtained using completely different data, methodology and approximations [127]. Indeed, in ref. [127], the whole-genome diversity at several geographic locations was analyzed (rather than the frequency of an individual genetic marker), only the inland route was considered (not the Mediterranean one), and only four locations (along the inland route) were used to compute the effects of migration and interbreeding. Given these substantial differences, the agreement between both ranges seems noteworthy. Previous work on ancient DNA (e.g., ref. [128]) apparently had not estimated the percentage of farmers who interacted with hunter-gatherers. Overall, Figure 4 shows another original idea by Cavalli-Sforza (Figure 4a) that remains clearly influential and useful in present research (Figure 4b).
The topic on genetic clines reviewed in this section is based on genetic data, but it is directly related to the discussion of spread rates in Section 2, which is based on archaeological data. To understand this, let us recall (Section 2) that cultural transmission [70] was combined with demic diffusion in a generalized, demic-cultural model [50] and, by requiring that the spread rate expected from this demic-cultural model agrees with the observed spread rate from archaeological data, it was estimated that the intensity of cultural transmission η was in the range 0 ≤ η ≤ 2.5 (Figure 3a), which in turn implies that the effect of cultural diffusion on the spread rate had been between 0% and 48% (Figure 3b) [50]. This has been explained in detail in Sec. 2. But using the genetic estimation above, i.e., 0.01 ≤ η ≤ 0.03 (obtained from the Neolithic cline of haplogroup K in Figure 4b), Figure 3b implies a much narrower estimation, namely that the effect of cultural diffusion on the spread rate was 0.7%–2.3%, i.e., about 1%–2%. This agrees with the archaeological range above (0%-48%) but is substantially more precise. Therefore, the effect of demic diffusion was 98-99% (see Eqs. (8) and (9)). Admittedly, this is only a first estimation and, in the future, it will be of interest to simulate the clines of additional markers with different shapes and possible explanations. This example shows the potential of combining archaeological and genetic data, as done by Cavalli-Sforza in many of his works.
Besides a combination of cultural diffusion (admixture and/or acculturation) and demic diffusion, could the cline of haplogroup K have other possible explanations? One such explanation is selection, i.e., that some selective pressure against haplogroup K caused its frequency to decrease (note that the frequency of haplogroup K diminishes with increasing distance to the Near East in Figure 4b). However, there are no data indicating the existence of any selective pressure against haplogroup K. Moreover, neutrality tests of Early Neolithic K haplotypes do not show signs of selection (Supp. S1 in ref. [73]). Thus, it would be unreasonable to attribute the existence of this cline (squares and error bars in Figure 4b) to selection. A second possible explanation is isolation by distance, but as mentioned above, continent-wide clines have not been obtained in isolation-by-distance simulations [123]. A third possible explanation is surfing, but in other simulations it was observed that surfing mutations do not lead to continent-wide clines for Neolithic populations [126]. A side issue is that in ref. [126], the spread-rate was found to depend on the carrying capacity of the expanding population, which is at variance with well-established front propagation theory and many other simulations [87]. Clearly these topics and the possible relevance of surfing in Neolithic clines [123–126] deserve further work. It would be of particular interest to determine to what extent the results are affected by using interaction terms derived from cultural transmission theory [50]. In any case, any possible explanation for the cline of haplogroup K (alternative to a combination of demic and cultural diffusion) could be taken seriously only if it could reproduce that cline (squares in Figure 4b) by means of simulations based on realistic assumptions and parameter values.
Cavalli-Sforza and his collaborators also performed wave-of-advance simulations of genetic clines for other purposes. One goal was to infer the place of origin of a population expansion [121]. The limitations of this approach led Cavalli-Sforza to apply the method of principal component maps, as explained on p. 101 of the 1984 book [11]. A second example was to infer the place of origin of a mutation [124]. Other examples were related to the out-of-Africa expansion of modern humans (see the last part of Section 1).
Future Progress
During the next few decades, new archaeological data may make it possible to apply the wave-of-advance model to additional Neolithic expansions to those reviewed in Section 2 and refine, confirm or disprove the six laws suggested in Section 2.
Concerning the parametrization of wave-of-advance models, almost all work up to now has followed the early approach by Ammerman and Cavalli-Sforza [11,13] to estimate growth rates from ethnographic data. This is due to the absence of useful archaeological data for performing reliable estimations of population growth. However, in the last decade a new approach has emerged. It is based on the so-called summed probability distributions, which are essentially counts of the number of dated remains as a function of time and space, and are considered a realistic proxy for population numbers. This approach has led to impressive results, such as the discovery of population collapses in many regions of Europe after the initial boom due to the arrival of the Neolithic [129]. Using summed probability distributions, approximate estimations of growth rates were obtained for Scandinavia [101], but more detailed data now make it possible to fit exponential functions. In this way, it is now possible to estimate more realistic growth rates using archaeological rather than ethnographic data [130].
Another issue relevant to the purpose of parametrizing wave-of-advance models is the estimation of dispersal distances Δi and probabilities pi (Sections 1 and 2). In the concluding chapter of their 1984 book, Ammerman and Cavalli-Sforza stressed the importance of this topic as follows: “Much greater challenges are involved in obtaining estimates of migratory activity. At present time, the main source of information along these lines is that provided by ethnography, where data of the kind required are still scarce. It is to be expected that a better understanding of migratory processes in general will emerge as small-scale human populations are studied more closely.” Ammerman and Cavalli-Sforza used migratory data from ethnographic fieldwork [11], and all other authors followed the same approach (Section 2); unfortunately, the number of ethnographic studies on migratory activity (values of Δi and pi) is still limited (see Table S2 in ref. [83]). In 2005, it was proposed that genetics could make it possible to estimate the values of Δi and pi for prehistoric populations by identifying ancient parent-child pairs [77]. Such pairs were detected, first with the parent and child buried at the same site [131] and later in different places [132,133]. It seems possible that in coming decades, a sufficient number of such pairs will be detected for Neolithic populations. This could lead to a tremendous increase in the reliability of the parametrization of wave-of-advance models of Neolithic spread.
As additional data become available, the wave-of-advance model will surely be applied to the analysis of genetic clines due to other prehistoric range expansions besides the Neolithic in Europe (Section 3 and Figure 4).
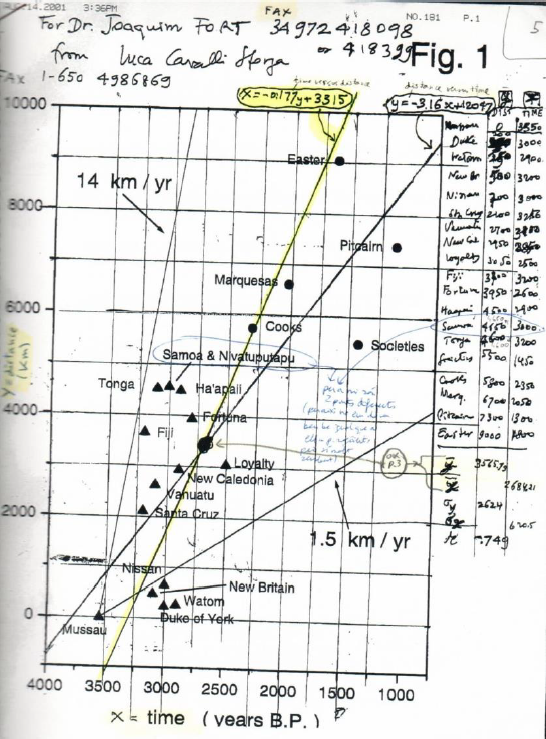
Cavalli-Sforza was interested in all human range expansions, not only in the spread of the Neolithic in Europe. An example is seen in Figure 5, which is a with his preliminary calculations on the spread of the Neolithic in Oceania. Also, as explained in Section 1, Cavalli-Sforza was very interested in the spread of cultural traits other than farming. His demic wave-of-advance model has been extended in a model with two dispersal mechanisms, one for individuals and another for cultural traits (non-local cultural transmission) [77]. This makes it possible to apply the wave-of-advance approach even to purely cultural expansions, so future applications may include the spread of innovations, not only in humans but also in other species [134].
Looking Back, Looking Forward
Cavalli-Sforza stated clearly that he had the objective to reconstruct human population history using mathematical methods (see ref. [6] and chapter 5 in ref. [2]). In an interview, he explained his reasoning for using mathematics as follows: “I have been always interested in quantitative prediction. I probably should have been a physicist” [135]. An especially appealing feature of the work by Cavalli-Sforza is that, as far as I know, no other researcher has made so many important contributions to mathematical theories of human population history.
None of the work during the last decades that has been reviewed in this paper (Figures 1b, 2b, 3 and 4b) would have been possible without the pioneering contributions by Cavalli-Sforza (Figures 1a, 2a and 4a). These are only a few examples of the many novel ideas introduced by Cavalli-Sforza that were very successful. To the best of my knowledge, no other researcher has made such great discoveries in both science and the humanities. For example, his pioneering work established the major importance of drift in genetics and demic diffusion in archaeology [136]. It is possible that such major discoveries are not always appreciated nowadays. Indeed, a leading researcher on ancient human genetics wrote a few years ago: “The few major new claims that Cavalli-Sforza did make have essentially all been proven wrong” [137]. But this would perhaps not trouble Cavalli-Sforza, because sometimes he had to cope with non-enthusiastic reactions to his work. Some examples are the following. (i) Many archaeologists disagreed with the idea that demic diffusion had driven the spread of the Neolithic in Europe [21–25]. (ii) Alan G. Fix maintained that the main mechanism responsible for genetic clines could have been selection (rather than the combination of demic and cultural diffusion) [138] but in fact selection was not important, see e.g. text S1 in Ref [73]. (iii) Several authors criticized the use of principal component analysis [32,139,140], but Cavalli-Sforza and others defended this method [141–143]. (iv) Robert Sokal originally overstated his contribution to the study of demic diffusion according to Cavalli-Sforza [144], but Sokal eventually kindly acknowledged Cavalli-Sforza’s pioneering work in that area [145]. (v) Sykes, Richards and some other geneticists claimed that Cavalli-Sforza had underestimated the genetic contribution of hunter-gatherers [33,35,49] and even suggested that grand syntheses based on the wave-of-advance model should be ‘a thing of the past’ [35], but their claims were criticized by other geneticists on purely population genetic grounds [36,43,44,146]. Clearly, today Cavalli-Sforza’s wave-of-advance model is not ‘a thing of the past’ at all. It is important in linguistics [66,67,147], archaeology (Section 2) and genetics (Section 3). The wave-of-advance model has been further developed in many directions mathematically and applied to numerous prehistoric spread phenomena. Much more archaeological and genetic data will become available in the future and the wave-of-advance model will be applied to more case studies, not only concerning spread rates (Section 2) but also to understand ancient genetic clines and their implications (Section 3). Therefore, it is reasonable to expect that the contributions by Cavalli-Sforza reviewed in this paper will remain a gold standard for future work.
Declarations
Competing Interests
The author has declared that no competing interests exist.
Acknowledgement
This work has been partially funded by the Ministerio de Ciencia e Innovación (grant PID2019-104585GB-I00) and the Institució Catalana d’Estudis Avançats (ICREA Academia grant 2022-2026).
References
| 1. |
Cavalli-Sforza LL. Genes, peoples, and languages. Sci Am. 1991;265:104-110.
[Google Scholar]
[CrossRef]
|
| 2. |
Cavalli-Sforza LL, Cavalli-Sforza F. The great human diasporas: The history of diversity and evolution. New York: Addison-Wesley; 1995.
|
| 3. |
Cavalli-Sforza LL. Archaeology, genetics and language: Reflecting on five decades of human genetics. In: Jones M, editor. Traces of ancestry: Studies in honour of Colin Renfrew. Cambridge: McDonald Institute for Archaeological Research; 2004. p.3-10.
[Google Scholar]
|
| 4. |
Childe VG. The dawn of civilization. London: Routledge; 1957.
|
| 5. |
Clark JGD. Radiocarbon dating and the expansion of farming culture from the Near East over Europe. Proc Prehistoric Soc. 1965;31:58-73.
[Google Scholar]
[CrossRef]
|
| 6. |
Cavalli-Sforza LL. Similarities and dissimilarities of sociocultural and biological evolution. In: Hodson FR, Kendall DG, Tautu P, editor. Mathematics in the archeological and historical sciences. Edinburgh: Edinburg University Press; 1971.
[Google Scholar]
|
| 7. |
Ammerman AJ. Personal communication. 2021 June 01.
|
| 8. |
Ammerman AJ, Cavalli-Sforza LL. Measuring the rate of spread of early farming in Europe. Man. 1971;6:674-688.
[Google Scholar]
[CrossRef]
|
| 9. |
Fort J, Méndez V. Time-delayed theory of the Neolithic transition in Europe. Phys Rev Lett. 1999;82:867-870.
[Google Scholar]
[CrossRef]
|
| 10. |
Pinhasi R, Fort J, Ammerman AJ. Tracing the origin and spread of agriculture in Europe. PLoS Biol. 2005;3:2220-2228.
[Google Scholar]
[CrossRef]
|
| 11. |
Ammerman AJ, Cavalli-Sforza LL. The neolithic transition and the genetics of populations in Europe. New Jersey: Princeton University Press; 1984.
[CrossRef]
|
| 12. |
Cavalli-Sforza LL. Pygmies, an example of hunter-gatherers, and genetic consequences for man of domestication of plants and animals. Amsterdam: Excerpta Medica; 1971. p.79-95.
|
| 13. |
Ammerman AJ, Cavalli-Sforza LL. A population model for the diffusion of early farming in Europe. In: Renfrew C, editor. The explanation of culture change: Models in prehistory. London: Duckworth; 1973. p.343-357.
[Google Scholar]
|
| 14. |
Fisher RA. The wave of advance of advantageous genes. Ann Eugen. 1937;7:355-369.
[Google Scholar]
|
| 15. |
Skellman J. Random dispersal in theoretical populations. Biometrika. 1951;38:196-218.
[Google Scholar]
[CrossRef]
|
| 16. |
Berg C. Random walks in biology. Princeton: Princeton University Press; 1983.
|
| 17. |
Birdsell JB. Some population problems involving Pleistocene man. Cold Spring Harb Symp Quant Biol. 1957;22:47-69.
[Google Scholar]
[CrossRef]
|
| 18. |
Cavalli-Sforza LL. The distribution of migration distances: Models and applications to genetics. In: Sutter J, editor. Human Displacements. Monaco: Editions Sciences Humaines; 1962. p.139-158.
[Google Scholar]
|
| 19. |
Cavalli-Sforza LL, Bodmer WF. The genetics of human populations. San Francisco: Freeman; 1971.
|
| 20. |
Edmonson MS. Neolithic diffusion rates. Curr Anthropol. 1961;2:74-102.
[Google Scholar]
|
| 21. |
Zvelebil M. Book review on ‘The Neolithic transition and the genetics of populations in Europe’, by A. J. Ammerman and L. L. Cavalli-Sforza. J Arch Sci. 1986;13:93-95.
[Google Scholar]
[CrossRef]
|
| 22. |
Dennell RW. The orginis of crop agriculture in Europe. In: Cowan CW, Watson PJ, editor. The origins of agriculture. An international perspective. Washington: Smithsonian Institution Press; 1992. p.71-100.
[Google Scholar]
|
| 23. |
Thomas J. The cultural context of the first use of domesticates in continental central and northwest Europe. In: Harris DR, editor. The origins and spread of agriculture and pastoralism in Eurasia. London: UCL Press; 1996. p.310-322.
[Google Scholar]
|
| 24. |
Whittle A. Europe in the Neolithic: The creation of new worlds. Cambridge: Cambridge University Press; 1996.
|
| 25. |
Barker G. The agricultural revolution in prehistory. Oxford: Oxford University Press; 2006.
|
| 26. |
Cavalli-Sforza LL. Demic diffusion as the basic process of human expansions. In: Bellwood P, Renfrew C, editor. Examining the farming/language dispersal hypothesis. Cambridge: McDonald Institute for Archaeological Research; 2002. p.79-88.
[Google Scholar]
|
| 27. |
Cavalli-Sforza LL, Menozzi P, Piazza A. The history and geography of human genes. Princeton: Princeton University Press; 1994.
|
| 28. |
Ammerman AJ. The Neolithic Transition in Europe at 50 Years. In: Grygiel M, Obst PJ, editor. Feschrift in Honor of Ryszard Grygiel and Peter Bogucki. Poland: Krakow. in press.
[Google Scholar]
|
| 29. |
Menozzi P, Piazza A, Cavalli-Sforza LL. Synthetic maps of human gene frequencies in Europeans. Science. 1978;201:786-792.
[Google Scholar]
[CrossRef]
|
| 30. |
Sokal RR, Menozzi P. Spatial autocorrelations of HLA frequencies in Europe support demic diffusion of early farmers. Am Nat. 1982;119:1-17.
[Google Scholar]
[CrossRef]
|
| 31. |
Sokal RR, Oden NL, Wilson C. Genetic evidence for the spread of agriculture in Europe by demic diffusion. Nature. 1991;351:143-145.
[Google Scholar]
[CrossRef]
|
| 32. |
Sokal RS, Oden NL, Thomson BA. Problems with synthetic maps remain: Reply to Rendine et al. Hum Biol. 1999;71:447-453.
[Google Scholar]
|
| 33. |
Richards M, Côrte-Real H, Forster P, Macaulay V, Wilkinson-Herbots H, Demaine A, et al. Palaeolithic and Neolithic lineages in the European mitochondrial gene pool. Am J Hum Genet. 1996;59:185-203.
[Google Scholar]
|
| 34. |
Richards M, Macaulay V, Sykes B, Pettitt P, Hedges R, Forster P, et al. Reply to Cavalli-Sforza and Minch. Am J Hum Genet. 1997;61:251-254.
[Google Scholar]
|
| 35. |
Richards M, Macaulay V, Bandelt H-J. Analyzing genetic data in a model-based framework: Inferences about European prehistory. In: Bellwood P, Renfrew C, editor. Examining the farming/language dispersal hypothesis. Cambridge: McDonald Institute for Archaeological Research; 2002. p.459-466.
[Google Scholar]
|
| 36. |
Barbujani G, Bertorelle G, Chikhi L. Evidence for Paleolithic and Neolithic gene flow in Europe. Am J Hum Genet. 1998;62:488-491.
[Google Scholar]
[CrossRef]
|
| 37. |
Belle EMS, Landry PA, Barbujani G. Origins and evolution of the Europeans genome: Evidence from multiple microsatellite loci. Proc Royal Soc B. 2006;273:1595-1602.
[Google Scholar]
[CrossRef]
|
| 38. |
Barbujani G. Human genetics: Message from the Mesolithic. Curr Biol. 2012;22:R631-R633.
[Google Scholar]
[CrossRef]
|
| 39. |
Barbujani G. Genetic evidence for prehistoric demographic changes in Europe. Hum Hered. 2013;76:133-141.
[Google Scholar]
[CrossRef]
|
| 40. |
Chikhi L, Destro-Bisol G, Pascali V, Baravelli V, Dobosz M, Barbujani G. Clinal variation in the nuclear DNA of Europeans. Hum Biol. 2009;81(5/6):625-638.
[Google Scholar]
[CrossRef]
|
| 41. |
Chikhi L. Update to Chikhi et al.’s “Clinal Variation in the Nuclear DNA of Europeans” (1998): Genetic Data and Storytelling—From Archaeogenetics to Astrologenetics? Hum Biol. 2009;81:639-643.
[Google Scholar]
[CrossRef]
|
| 42. |
Chikhi L, Destro-Bisol G, Bertorelle G, Pascali V, Barbujani G. Clines of nuclear DNA markers suggest a largely Neolithic ancestry of the European gene pool. Proc Natl Acad Sci USA. 1998;95:9053-9058.
[Google Scholar]
[CrossRef]
|
| 43. |
Chikhi L, Nichols RA, Barbujani G, Beaumont MA. Y genetic data support the Neolithic demic diffusion model. Proc Natl Acad Sci USA. 2002;99:11008-11103.
[Google Scholar]
[CrossRef]
|
| 44. |
Goldstein DB, Chikhi L. Human Migrations and Population Structure: What We Know and Why it Matters. Ann Rev Genomics Hum Genet. 2002;3:129-152.
[Google Scholar]
[CrossRef]
|
| 45. |
Haak W, Forster P, Bramanti B, Matsumura S, Brandt G, Tänzer M, et al. Ancient DNA from the first European farmers in 7500-year-old Neolithic sites. Science. 2005;310:1016-1018.
[Google Scholar]
[CrossRef]
|
| 46. |
Balter M. Ancient DNA yields clues to the puzzle of European origins. Science. 2005;310:964-965.
[Google Scholar]
[CrossRef]
|
| 47. |
Bramanti B, Thomas MG, Haak W, Unterlaender M, Jores P, Tambets K, et al. Genetic discontinuity between local hunter-gatherers and central Europe’s first farmers. Science. 2009;326:137-140.
[Google Scholar]
[CrossRef]
|
| 48. |
Thorne IJ. The origins of agriculture in Europe. London: Rotledge; 1996.
|
| 49. |
Sykes B. The seven daughters of Eve. New York: W. W. Norton & Company Inc.; 2001.
|
| 50. |
Fort J. Synthesis between demic and cultural diffusion in the Neolithic transition in Europe. Proc Natl Acad Sci USA. 2012;109:18669-18673.
[Google Scholar]
[CrossRef]
|
| 51. |
Sykes B. The molecular genetics of European ancestry. Philos Trans Royal Soc Lond B Biol Sci. 1999;354:131-139.
[Google Scholar]
|
| 52. |
Semino O, Passarino G, Oefner PJ, Lin AA, Arbuzova S, Beckman LE, et al. The genetic legacy of Paleolithic Homo Sapiens: A Y chromosome perspective. Science. 2000;290:1155-1159.
[Google Scholar]
[CrossRef]
|
| 53. |
Manen C, Perrin T, Guilaine J, Bouby L, Bréhard S, Briois F, et al. The Neolithic transition in the western Mediterranean: A complex and non-linear diffusion process—The radiocarbon record revisited. Radiocarbon. 2019;61:531-571.
[Google Scholar]
[CrossRef]
|
| 54. |
Fort J, Pérez-Losada J, Isern N. Fronts from integrodifference equations and persistence effects on the Neolithic transition. Phys Rev E. 2007;76:031913.
[Google Scholar]
[CrossRef]
|
| 55. |
Cavalli-Sforza LL. Recollections of Whittingehame Lodge. Theor Popul Biol. 1990;38:301-305.
[Google Scholar]
[CrossRef]
|
| 56. |
Cavalli-Sforza LL. Returning to the Neolithic transition in Europe. In: The widening haverst. In: Ammerman A J, Biaggi P, editor. The Neolithic transition in Europe: Looking back, looking forward. Boston: Archaeological Institute of America; 2003. p.297-313.
[Google Scholar]
|
| 57. |
Cavalli-Sforza LL. Personal communication. 2001 August 17.
|
| 58. |
Fort J, Pujol T, Cavalli-Sforza LL. Palaeolithic populations and waves of advance. Cambridge Archaeol J. 2004;14:53-61.
[Google Scholar]
[CrossRef]
|
| 59. |
Henn BM, Cavalli-Sforza LL, Feldman MW. The great human expansion. Proc Natl Acad Sci USA. 2012;109:17758-17764.
[Google Scholar]
[CrossRef]
|
| 60. |
Mellars P. A new radiocarbon revolution and the dispersal of modern humans in Eurasia. Nature. 2006;439:931-935.
[Google Scholar]
[CrossRef]
|
| 61. |
Steele J. Human dispersals: Mathematical models and the archaeological record. Hum. Biol. 2009;81:121-140.
[Google Scholar]
[CrossRef]
|
| 62. |
Mellars P. The earliest modern humans in Europe. Nature. 2011;479:483-485.
[Google Scholar]
[CrossRef]
|
| 63. |
Romanowska I, Gamble C, Bullock S, Sturt F. Dispersal and the Movius Line: Testing the effect of dispersal on population density through simulation. Quat Int. 2017;431:53-63.
[Google Scholar]
[CrossRef]
|
| 64. |
Ramachandran S, Deshpande O, Roseman CC, Rosenberg NA, Feldman MW, Cavalli-Sforza L.L. Support from the relationship of genetic and geographic distance in human populations for a serial founder effect originating in Africa. Proc Natl Acad Sci USA. 2005;102:15942-15947.
[Google Scholar]
[CrossRef]
|
| 65. |
Atkinson QD. Phonemic diversity supports a serial founder effect model of language expansion from Africa. Science. 2011;332:346-349.
[Google Scholar]
[CrossRef]
|
| 66. |
Fort J, Pérez-Losada J. Can a linguistic serial founder effect originating in Africa explain the worldwide phonemic cline? J R Soc Interface. 2016;13:20160185.
[Google Scholar]
[CrossRef]
|
| 67. |
Pérez-Losada J, Fort J. A serial founder effect model of phonemic diversity based on phonemic loss in low-density populations. PLoS One. 2018;13:e0198346.
[Google Scholar]
[CrossRef]
|
| 68. |
Gerbault P, Powell A, Thomas MG. Evaluating demographic models for goat domestication using mt-DNA sequences. Anthropozoologica. 2012;47:65-78.
[Google Scholar]
[CrossRef]
|
| 69. |
Gerbault P, Allaby RG, Boivin N, Rudzinski A, Grimaldi IM, Pires JC, et al. Storytelling and story testing in domestication. Proc Natl Acad Sci USA. 2014;111:6159-6164.
[Google Scholar]
[CrossRef]
|
| 70. |
Cavalli-Sforza LL, Feldman MW. Cultural transmission and evolution: A quantitative approach. New Jersey: Princeton University Press; 1981.
|
| 71. |
Fort J. Front propagation and cultural transmission. Theory and application to Neolithic transitions. Chaos, Solitions Fractals. 2021;148:111060.
[Google Scholar]
[CrossRef]
|
| 72. |
Fort J. Vertical cultural transmission effects on demic front propagation: Theory and application to the Neolithic transition in Europe. Phys Rev E. 2011;83:056124.
[Google Scholar]
[CrossRef]
|
| 73. |
Isern N, Fort J, Rioja V. The ancient cline of haplogroup K implies that the Neolithic transition in Europe was mainly demic. Sci Rep. 2017;7:11229.
[Google Scholar]
[CrossRef]
|
| 74. |
Gkiasta M, Russell T, Shennan S, Steele J. Neolithic transition in Europe: The radiocarbon record revisited. Antiquity. 2003;77:45-62.
[Google Scholar]
[CrossRef]
|
| 75. |
Bocquet-Appel J-P, Naji S, vander Linden M, Kozlowski J. Understanding the rates of expansion of the farming system in Europe. J Archaeol Sci. 2012;39:531-546.
[Google Scholar]
[CrossRef]
|
| 76. |
Porcic M, Blagojevic T, Pendic J, Stefanovic S. The timing and tempo of the Neolithic expansion across the central Balkans in the light of the new radiocarbon evidence. J Archaeol Sci Rep. 2020;33:102528.
[Google Scholar]
[CrossRef]
|
| 77. |
Fort J. Demic and cultural diffusion propagated the Neolithic transition across different regions of Europe. J R Soc Interface. 2015;12:20150166.
[Google Scholar]
[CrossRef]
|
| 78. |
Isern N, Fort J. Modelling the effect of Mesolithic populations on the slowdown of the Neolithic transition. J Archaeol Sci. 2012;39:3671-3676.
[Google Scholar]
[CrossRef]
|
| 79. |
Isern N, Fort J, vander Linden M. Space competition and time delays in human range expansions. Application to the Neolithic transition. PLoS One. 2012;7:e51106.
[Google Scholar]
[CrossRef]
|
| 80. |
Betti L, Beyer RM, Jones ER, Eriksson A, Tassi F, Siska V, et al. Climate shaped how Neolithic farmers and European hunter-gatherers interacted after a major slowdown from 6,100 BCE to 4,500 BCE. Nat Hum Behav. 2020;4:1004-1010.
[Google Scholar]
[CrossRef]
|
| 81. |
Henderson DA, Baggaley AW, Shukurov A, Boys RJ, Sarson GR, Golightly A. Regional variations in the European Neolithic dispersal: The role of the coastlines. Antiquity. 2014;88:1291-1302.
[Google Scholar]
[CrossRef]
|
| 82. |
Davison K, Dolukhanov P, Sarson GR, Shukurov A. The role of waterways in the spread of the Neolithic. J Archaeol Sci. 2006;23:641-652.
[Google Scholar]
[CrossRef]
|
| 83. |
Fort J. Biased dispersal can explain fast human range expansions. Sci Rep. 2020;10:9036.
[Google Scholar]
[CrossRef]
|
| 84. |
Zilhao J. Radiocarbon evidence for maritime pioneer colonization at the origins of farming in west Mediterranean Europe. Proc Natl Acad Sci USA. 2001;98:14180-14185.
[Google Scholar]
[CrossRef]
|
| 85. |
Zilhao J. Personal communication. 2006 March 10.
|
| 86. |
Isern N, Zilhao J, Fort J, Ammerman A J. Modeling the role of voyaging in the coastal spread of the early Neolithic in the West Mediterranean. Proc Natl Acad Sci USA. 2017;114:897-902.
[Google Scholar]
[CrossRef]
|
| 87. |
Fort J, Pujol T. Progress in front propagation research. Rep Prog Phys. 2008;71:086001.
[Google Scholar]
[CrossRef]
|
| 88. |
Fort J, Pujol T, vander Linden M. Modelling the Neolithic transition in the Near East and Europe. Am Antiq. 2012;77:203-220.
[Google Scholar]
[CrossRef]
|
| 89. |
Baggaley AW, Boys RJ, Golightly A, Sarson GR, Shukurov A. Inference for population dynamics in the Neolithic period. Ann Appl Stat. 2012;6:1352-1376.
[Google Scholar]
[CrossRef]
|
| 90. |
Baggaley AW, Sarson GR, Shukurov A, Boys RJ, Golightly A. Bayesian inference for a wave-front model of the neolithization of Europe. Phys Rev E. 2012;86:016105.
[Google Scholar]
[CrossRef]
|
| 91. |
Gagal K, Sarson GR, Shukurov A. The near-eastern roots of the Neolithic in South Asia. PLoS One. 2014;9:e95714.
[Google Scholar]
[CrossRef]
|
| 92. |
de Souza JG, Mateos JA, Madella M. Archaeological expansions in tropical South America during the late Holocene: Assessing the role of demic diffusion. PLoS One. 2020;15:e0232367.
[Google Scholar]
[CrossRef]
|
| 93. |
de Souza JG, Silva F, Madella M. Reassessing the role of climate change in the Tupi expansion (South America, 5000-500 BP). J R Soc Interface. 2021;18:2021049.
[Google Scholar]
[CrossRef]
|
| 94. |
Bernabeu J, Barton CM, Pardo-Gordó S, Bergin SM. Modeling initial Neolithic dispersal. The first agricultural groups in West Mediterranean. Ecol Modell. 2015;307:22-31.
[Google Scholar]
[CrossRef]
|
| 95. |
Pardo-Gordó S, Bergin SM, Bernabeu J, Barton M. Alternvative stories of agricultural origins: The Neolithic spread in the Iberian peninsula. In: García-Puchol O, Salazar-García DC, editor. Times of the Neolithic transition along the Western Mediterranean. Cham: Springer; 2017.
[Google Scholar]
[CrossRef]
|
| 96. |
Conolly J, Colledge S, Shennan S. Founder effect, drift, and adaptive change in domestic crop use in early Neolithic Europe. J Archaeol Sci. 2008;35:2797-2804.
[Google Scholar]
[CrossRef]
|
| 97. |
Pérez-Losada J, Fort J. Spatial dimensions increase the effect of cultural drift. J Archaeol Sci. 2011;38:1294-1299.
[Google Scholar]
[CrossRef]
|
| 98. |
Fort J. The spread of agriculture: Quantitative laws in prehistory?. In: Pardo-Gordó S, Bergin S, editor. Simulating Transitions to Agriculture in Prehistory. Cham: Springer; 2021. p.17-28.
[Google Scholar]
[CrossRef]
|
| 99. |
Isern N, Fort J. Assessing the importance of cultural diffusion in the Bantu spread into southeastern Africa. PLoS One. 2019;14:e0215573.
[Google Scholar]
[CrossRef]
|
| 100. |
Cobo JM, Fort J, Isern N. The spread of domesticated rice in eastern and southeastern Asia was mainly demic. J Archaeol Sci. 2019;101:123-130.
[Google Scholar]
[CrossRef]
|
| 101. |
Fort J, Pareta MM, Sorensen L. Estimating the relative importance of demic and cultural diffusion in the spread of the Neolithic in Scandinavia. J R Soc Interface. 2018;15:20180597.
[Google Scholar]
[CrossRef]
|
| 102. |
Jerardino A, Fort J, Isern N, Rondelli B. Cultural diffusion was the main driving mechanism of the Neolithic transition in Southern Africa. PLos One. 2014;9:e113672.
[Google Scholar]
[CrossRef]
|
| 103. |
Fort J, Pujol T. Time-delayed fronts from biased random walks. New J Phys. 2007;9:234.
[Google Scholar]
|
| 104. |
Fort J. Population expansion in the western Pacific (Austronesia): A wave of advance model. Antiquity. 2003;77:520-530.
[Google Scholar]
[CrossRef]
|
| 105. |
Fort J, Kohler TA, Blake M. The spread of maize in America. In preparation. 2021.
[Google Scholar]
|
| 106. |
Barber N. On the relationship between fertility and geographic latitude: a cross-national study. Cross Cult Res. 2002;36:3-15.
[Google Scholar]
[CrossRef]
|
| 107. |
Hamilton MJ, Buchanan B. Spatial gradients in Clovis-age radiocarbon dates across North America suggest rapid colonization from the north. Proc Natl Acad Sci USA. 2007;104:15625-15630.
[Google Scholar]
[CrossRef]
|
| 108. |
Steele J, Politis G. AMS 14C dating of early human occupation of southern South America. J Archaeol Sci. 2009;36:419-429.
[Google Scholar]
[CrossRef]
|
| 109. |
Isern N, Fort J, Pérez-Losada J. Realistic dispersion kernels applied to cohabitation reaction-dispersion equations. J Stat Mech. Theory Exp. 2008;2008:P10012.
[Google Scholar]
|
| 110. |
Rendine S, Piazza A, Cavalli-Sforza LL. Simulation and separation by principal components of multiple demic expansions in Europe. Am Nat. 1986;128:681-706.
[Google Scholar]
[CrossRef]
|
| 111. |
Aoki K, Shida K, Shigesada N. Travelling wave solutions for the spread of farmers into a region occupied by hunter-gatherers. Theor Popul Biol. 1996;50:1-17.
[Google Scholar]
[CrossRef]
|
| 112. |
Patterson MA, Sarson GR, Sarson HC, Shukurov A. Modelling the Neolithic transition in a heterogeneous environment. J Archaeol Sci. 2010;37:2929-2937.
[Google Scholar]
[CrossRef]
|
| 113. |
Aoki K. A three-population wave-of-advance model for the European early Neolithic. PLoS One. 2020;15:e0233184.
[Google Scholar]
[CrossRef]
|
| 114. |
Ackland GJ, Signitzer M, Stratford K, Cohen MH. Cultural hitchhiking on the wave of advance of beneficial technologies. Proc Natl Acad Sci USA. 2007;104:8714-8719.
[Google Scholar]
[CrossRef]
|
| 115. |
Lodewijckx M, Bakels CC. Frontier settlements of the LBK in central Belgium. In: Hofmann D, Bickle P, editor. Creating Communities. New advances in Central European Neolithic Research. Oxford and Oakville: Oxbow Books; 2009. p.32-49.
[Google Scholar]
[CrossRef]
|
| 116. |
Shennan S. The first farmers of Europe. An evolutionary perspective. Cambridge: Cambridge University Press; 2018.
[Google Scholar]
|
| 117. |
Mittnik A, Wang CC, Pfrengle S, Daubaras M, Zarina G, Hallgren F, et al. The genetic prehistory of the Baltic Sea region. Nat Commun. 2018;9:442.
[Google Scholar]
|
| 118. |
Antonio ML, Gao Z, Moots HM, Lucci M, Candilio F, Sawyer S, et al. Ancient Rome: A genetic crossroads of Europe and the Mediterranean. Science. 2019;366:708-714.
[Google Scholar]
|
| 119. |
Brunel S, Bennett EA, Cardin L, Garraud D, Emam HB, Beylier A, et al. Ancient genomes from present-day France unveil 7,000 years of its demographic history. Proc Natl Acad Sci. 2020;117:12791-12798.
[Google Scholar]
[CrossRef]
|
| 120. |
Olalde I, Mallick S, Patterson N, Rohland N, Villalba-Mouco V, Silva M, et al. The genomic history of the Iberian peninsula over the past 8000 years. Science. 2019;363:1230-1234.
[Google Scholar]
|
| 121. |
Sgaramella-Zonta L, Cavalli-Sforza LL. Method for the detection of a genetic cline. In: Morton NE, editor. Genetic structure of populations. Honolulu: University of Hawaii Press; 1973. p.128-135.
[Google Scholar]
|
| 122. |
Barbujani G. Neolithic demic diffusion. Hum Popul Genet Genom. 2021;1:5.
[Google Scholar]
[CrossRef]
|
| 123. |
Barbujani G, Sokal RD, Oden NL. Indo-European origins: A computer simulation test of five hypothesis. Am J Phys Anthropol. 1995;96:109-132.
[Google Scholar]
[CrossRef]
|
| 124. |
Edmons C, Lillie A, Cavalli-Sforza L. Mutations arising in the wave front of an expanding population. Proc Natl Acad Sci USA. 2004;101:975-979.
[Google Scholar]
[CrossRef]
|
| 125. |
Currat M, Excoffier L. The effect of the Neolithic expansion on European molecular diversity. Proc Roy Soc B. 2005;272:679-688.
[Google Scholar]
[CrossRef]
|
| 126. |
Klopfstein S, Currat M, Escoffier L. The fate of mutations surfing on the wave of a range expansion. Mol Biol Evol. 2006;23:482-490.
[Google Scholar]
[CrossRef]
|
| 127. |
Marchi N, Winkelbach L, Schulz I, Brami M, Hofmanová Z, Blöcher J, et al. The mixed genetic origin of the first farmers in Europe. bioRxiv [Preprint]; 2020 https://doi.org/10.1101/2020.11.23.394502.
|
| 128. |
Mathieson I, Lazaridis I, Rohland N, Mallick S, Patterson N, Roodenberg SA, et al. Genome-wide patterns of selection in 230 ancient Eurasians. Nature. 2015;528:499-503.
[Google Scholar]
[CrossRef]
|
| 129. |
Shennan S, Downey SS, Timpson A, Edinborough K, Colledge S, Kerig T. Regional population collapse followed initial agriculture booms in mid-Holocene Europe. Nat Commun. 2013;4:2486.
[Google Scholar]
[CrossRef]
|
| 130. |
Porcic M, Blagojevic T, Pendic J, Stefanovic S. The Neolithic Demographic Transition in the Central Balkans: population dynamics reconstruction based on new radiocarbon evidence. Phil Trans R Soc B. 2021;376:20190712.
[Google Scholar]
[CrossRef]
|
| 131. |
Monroy JM, Jakobsson M, Günther T. Estimating genetic kin relationships in prehistoric populations. PLoS One. 2018;13:e0195491.
[Google Scholar]
[CrossRef]
|
| 132. |
Sánchez-Quinto F, Malmström H, Fraser M, Girdland-Flink L, Svensson EM, Simoes G, et al. Megalithic tombs in western and northern Neolithic Europe were linked to a kindred society. Proc Natl Acad Sci USA. 2019;116:9469-9474.
[Google Scholar]
[CrossRef]
|
| 133. |
Mittnik A, Massy K, Knipper C, Wittenborn F, Friedrich R, Pfrengle S, et al. Kinship-based social inequality in Bronze age Europe. Science. 2019;366:731-734.
[Google Scholar]
[CrossRef]
|
| 134. |
Klump BC, Martin JM, Wild S, Hörsch JK, Major RE, Aplin LM. Innovation and geographic spread of a complex foraging culture in an urban parrot. Science. 2021;373:456-460.
[Google Scholar]
[CrossRef]
|
| 135. |
Leavathes L. Scientist at work: Luigi Luca Cavalli-Sforza; A geneticist maps ancient migrations. The New York Times. 1993 July 27.
[Google Scholar]
|
| 136. |
Fort J. Luigi Luca Cavalli-Sforza (1922-2018). Hum Biol. 2018;90:89-95.
[Google Scholar]
[CrossRef]
|
| 137. |
Reich D. Who we are and how we got here. Ancient DNA the new science of the past. New York: Pantheon Books; 2018.
[Google Scholar]
|
| 138. |
Fix AG. Gene frequency clines in Europe: Demic diffusion or natural selection? J R Anthropol Inst G B Irel. 1996;2:625-643.
[Google Scholar]
[CrossRef]
|
| 139. |
Novembre J, Stephens M. Interpreting principal component analyses of spatial population genetic variation. Nat Genet. 2008;40:646-649.
[Google Scholar]
[CrossRef]
|
| 140. |
François O, Currat A, Ray N, Han E, Excoffier L, Novembre J. Principal component analysis under population genetic models of range expansion and admixture. Mol Biol Evol. 2010;27:1257-1268.
[Google Scholar]
[CrossRef]
|
| 141. |
Rendine S, Piazza A, Cavalli-Sforza LL. A problem with synthetic maps: Reply to Sokal et al. Hum Biol. 1999;71:15-25.
[Google Scholar]
|
| 142. |
Manni F. Interview with Luigi Luca Cavalli-Sforza: past research and directions for future investigations in human population genetics. Hum Biol. 2010;82:245-266.
[Google Scholar]
[CrossRef]
|
| 143. |
DeGiorgio M, Rosenberg NA. Geographic sampling scheme as a determinant of the major axis of genetic variation in principal component analysis. Mol Biol Evol. 2013;30:480-488.
[Google Scholar]
[CrossRef]
|
| 144. |
Cavalli-Sforza LL. Personal communication. 2005 June 29.
|
| 145. |
Sokal RR, Wilson C. Patterns of population spread. Nature. 1992;355:214.
[Google Scholar]
|
| 146. |
Barbujani G, Bertorelle G. Genetics and the population history of Europe. Proc Natl Acad Sci USA. 2001;98:22-25.
[Google Scholar]
|
| 147. |
Diamond J, Bellwood P. Farmers and their languages: The first expansions. Science. 2003;300:597-602.
[Google Scholar]
[CrossRef]
|
| 148. |
Bradshaw CJA, Norman K, Ulm S, Williams AN, Clarkson C, et al. Stochastic models support rapid peopling of Late Pleistocene Sahul. Nature Commun. 2021;12:2440.
[Google Scholar]
[CrossRef]
|