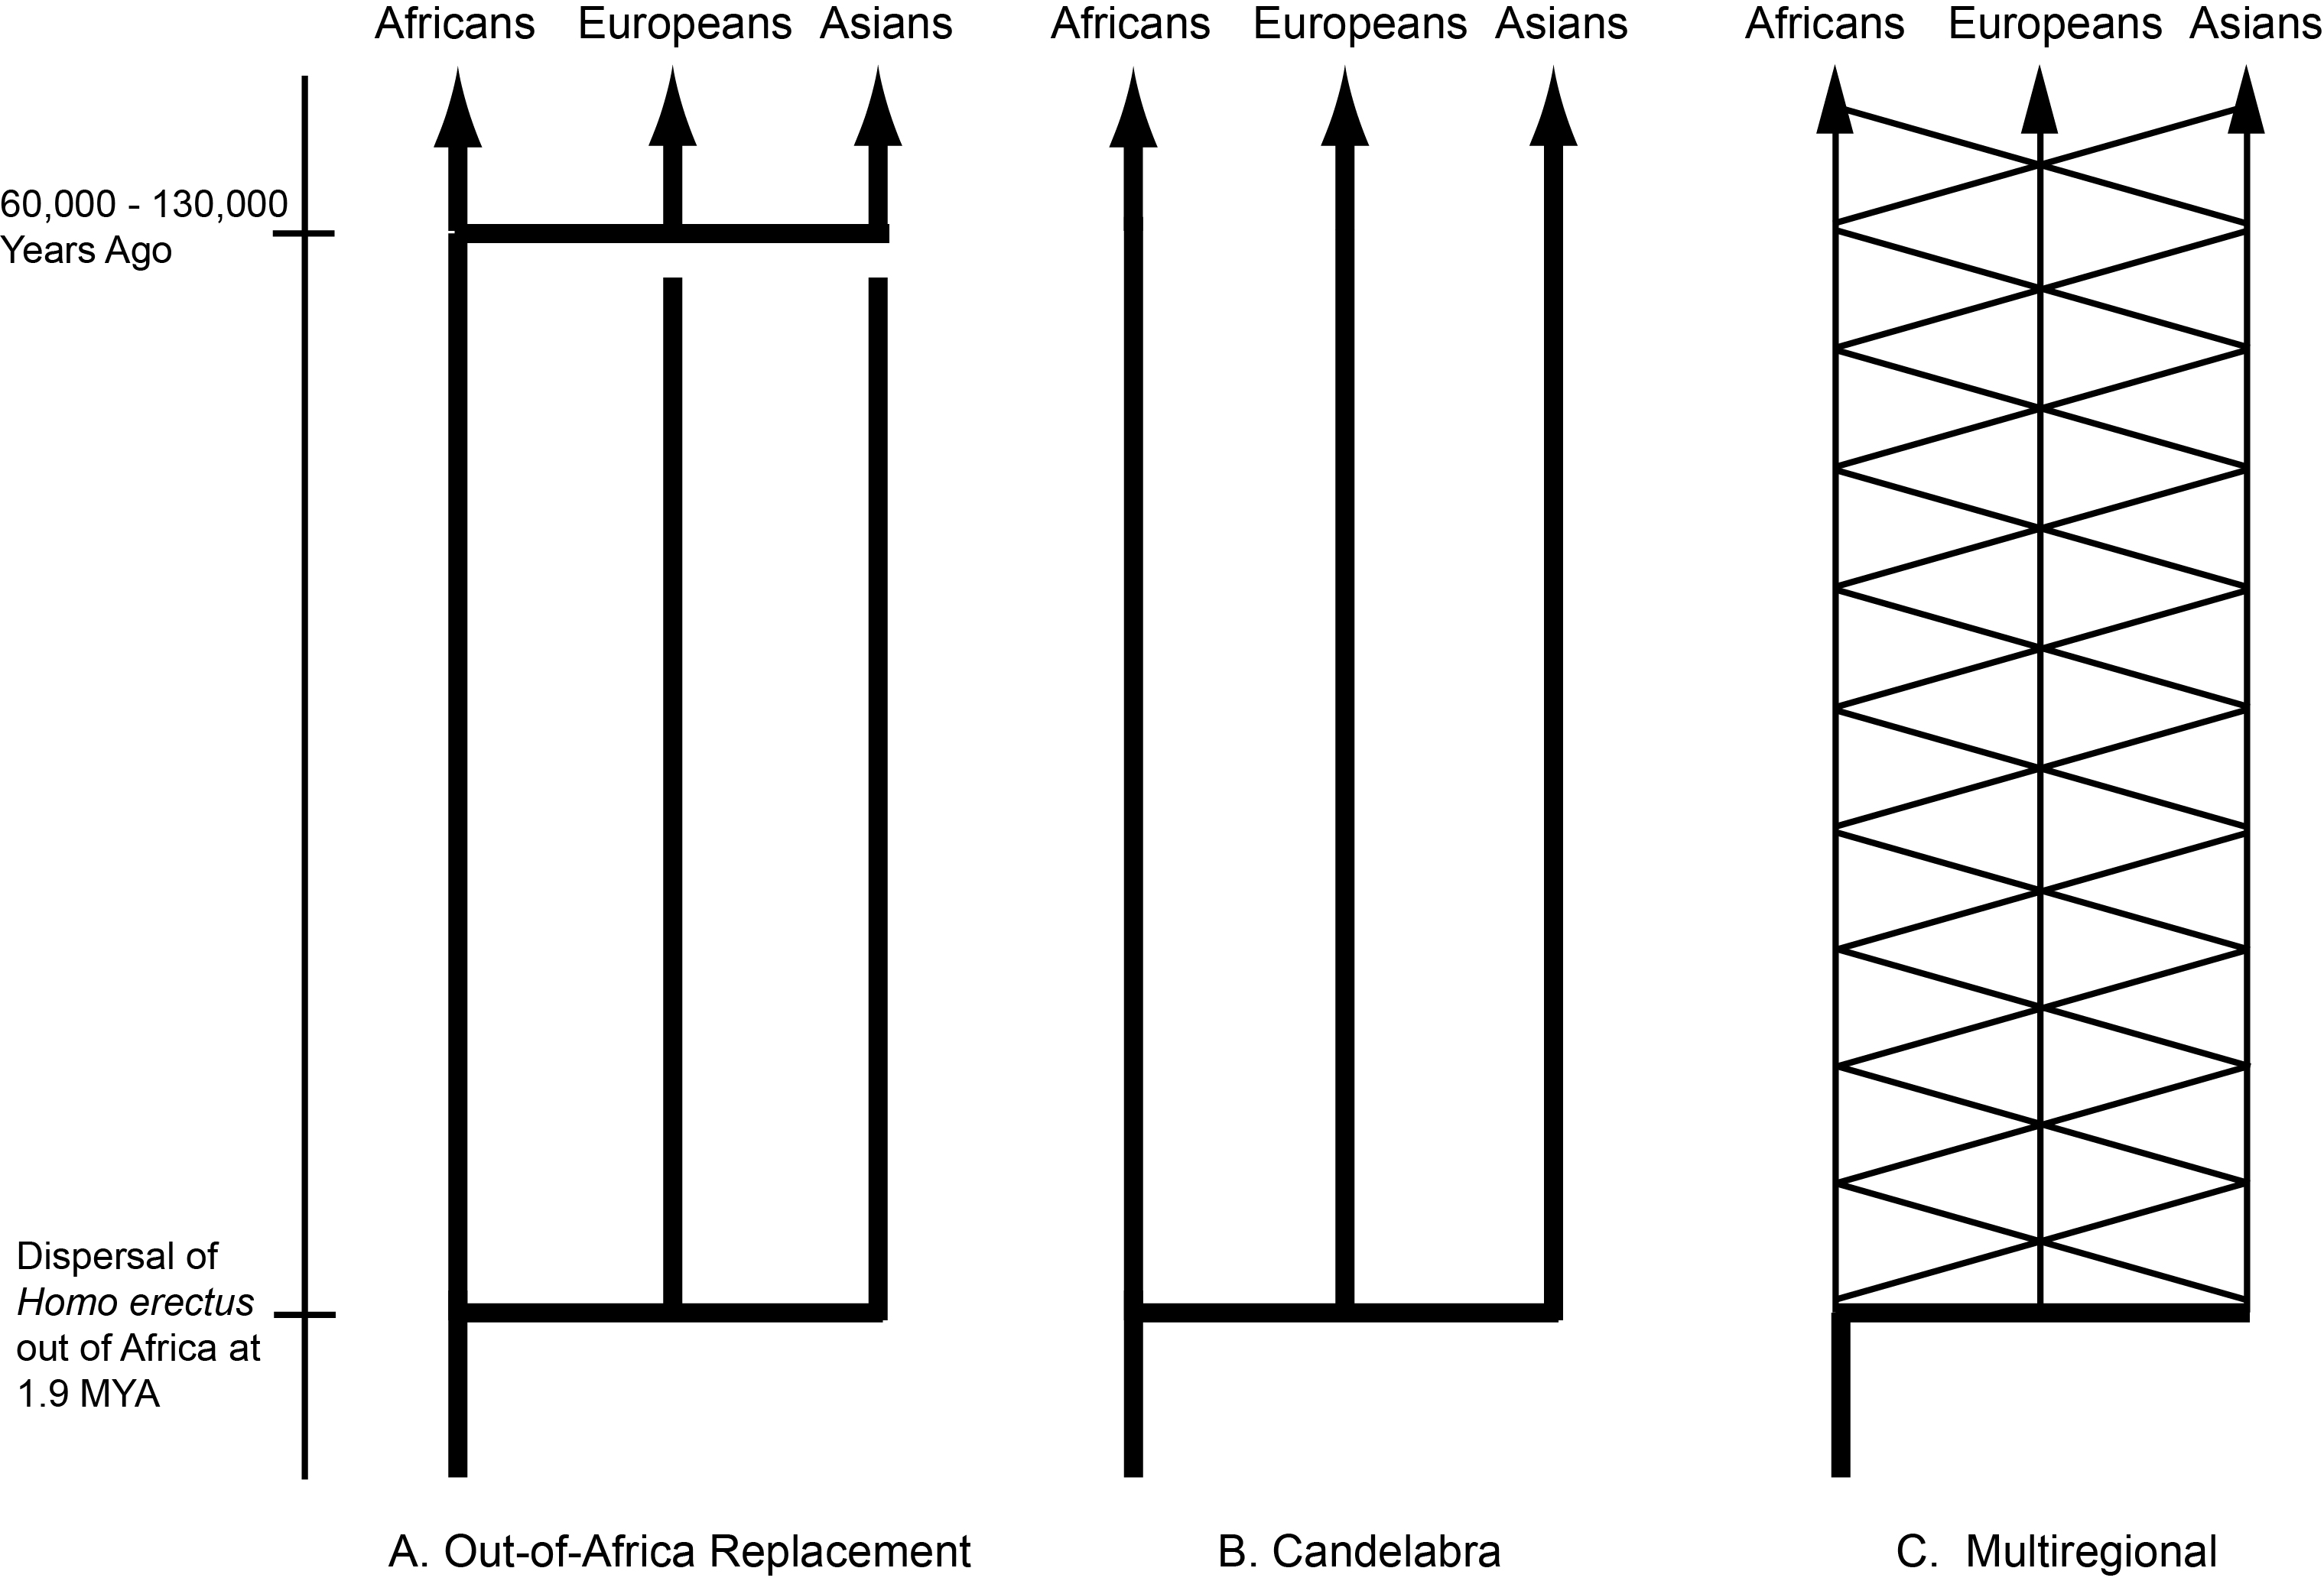
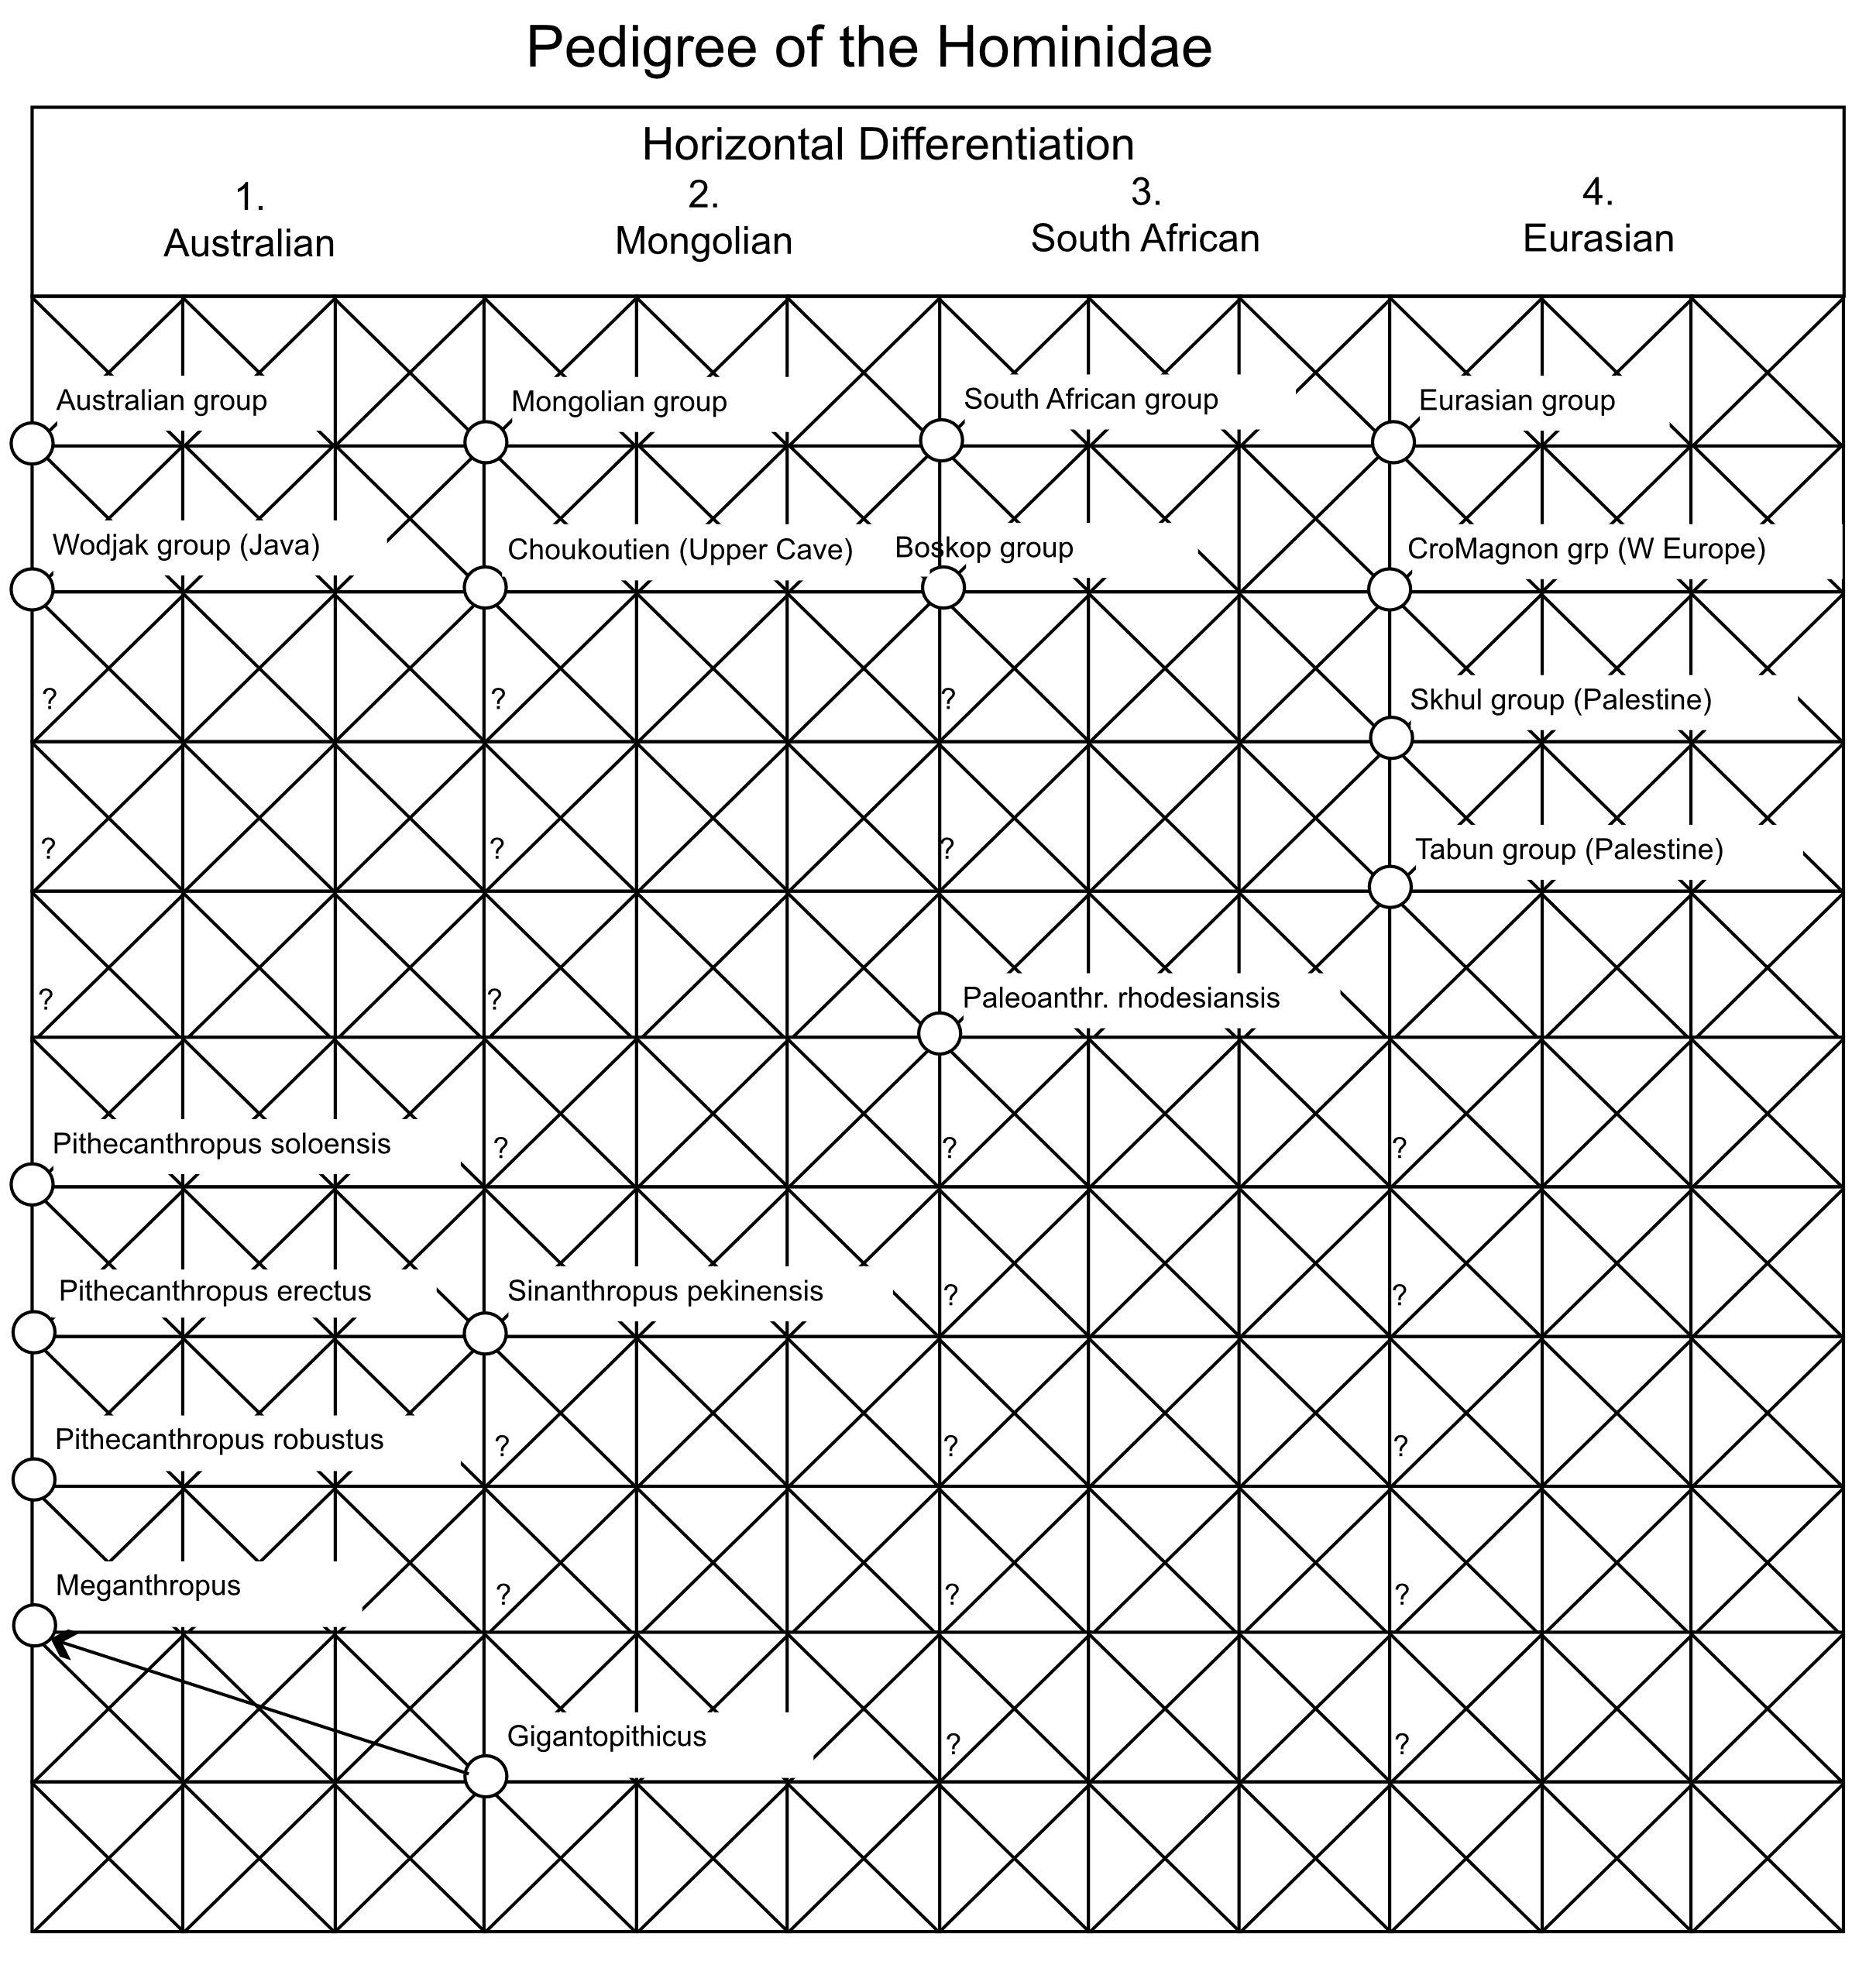
By the 1980’s CE, the paleontological record had convinced most scientists that the ancestors of humans had first evolved in Africa and then spread out into Eurasia in the early Pleistocene as Homo erectus. However, there was no consensus on what happened next. Three major models emerged by the latter half of the 20th century: the out-of-Africa replacement (OAR) model [1], the candelabra model of racial isolates [2], and the multiregional model [3,4] (Figure 1). Both the OAR and candelabra models posit that the expansion of Homo erectus into Eurasia results in independently evolving populations with no or extremely little genetic interchange. The OAR model in addition assumes a more modern form of humans, Homo sapiens, first evolved in Africa followed by an expansion into Eurasia, where the more modern humans completely replaced the archaic inhabitants of Eurasia. In both of these models, human evolution is dominated by splits into isolated lineages, followed by mostly independent evolution within the isolates. The OAR model in addition posits that the African isolate evolved into a form that expanded into Eurasia where it drove to extinction all the archaic Eurasians without genetic interchange with them. There is no or little role for gene flow in human evolution under these two models: rather, human evolution is dominated by splits, isolation, and extinction of lineages. Weidenreich’s multiregional model [3,4] takes an opposite position on the importance of these evolutionary forces. There are no splits or isolates in his model because all human populations are interconnected by gene flow. As Dobzhansky [5] emphasized in his 1944 review, these models of human evolution break down into two basic types: “the classic one, assumes that the course of the hominid evolution has been steadily divergent, producing a phylogenetic tree with many branches” (p. 259 in [5]), and “the second view, set forth very ably by Weidenreich” in which “a mutation or a genotype arisen in any one place is potentially able to reach all other human populations” (p. 260 in [5]). The dominant role of gene flow is evident in Weidenreich’s own graphical presentation of his model, shown in Figure 2 as redrawn from [4]. Weidenreich illustrates human evolution as a trellis, a reticulating pattern with no discernable tree-like structure. There was parallel evolution in all of these geographical regions because all of humanity was a single evolutionary lineage due to gene flow among these regions [5].
The relative status of these three models in the scientific community changed dramatically with the publication of Cann et al. [6] in 1987. This paper showed that the estimated tree of mitochondrial DNA (mtDNA) haplotypes in humans coalesced to a common ancestral molecule in Africa 140,000–290,000 years ago. They further concluded that this result is compatible with OAR but is incompatible with “An [emphasis mine] alternative view of human evolution”, giving two references [2,7] for this singular alternative view. However, reference 2 is Coon’s candelabra model (Figure 1B) whereas reference 7 is to an article by Wolpoff et al. that strongly supported an updated version of Weidenreich’s multiregional model (Figure 1C). Cann et al. therefore collapsed two polar opposite models of human evolution into a single “alternative view”. The text in Cann et al. indicates that the actual alternative model that they used was the candelabra model and the multiregional model was ignored. Their conclusions are also limited to the candelabra model and are not valid for the multiregional model. Cann et al. correctly noted that their inference of mtDNA coalesce is incompatible with the candelabra model; however the mtDNA coalescence time does not falsify the multiregional model [7]. Rephrasing the 1944 Dobzhansky quotation given in the previous paragraph into a coalescence framework, the common mtDNA ancestral molecule of all humanity could coalesce to any place inhabited by humans at that time, which of course includes Africa. Moreover, estimates of human population sizes during the time period of mtDNA coalescence have most humans living in Africa [8], so Africa is the most likely place of mtDNA coalescence under the multiregional model. Hence, the mtDNA tree is compatible with both OAR and the multiregional models and provides no discrimination between them [9,10]. By equating Coon’s candelabra model to Wolpoff et al.’s multiregional model, Cann et al. created the mistaken belief that the multiregional model had also been falsified. Indeed, many subsequent treatments of the work of Cann et al. completely ignored the multiregional model and only invoked the candelabra model, but often under the misnomer of “multiregional”. For example, one of the first textbooks on human evolution to feature the work of Cann et al. was Lewin [11], who presented the work of Cann et al. in a figure on page 104 of his book that consisted only of the models displayed here in Figure 1A and 1B. Labelling Coon’s candelabra model as the “multiregional” model has created much confusion that persists to this day.
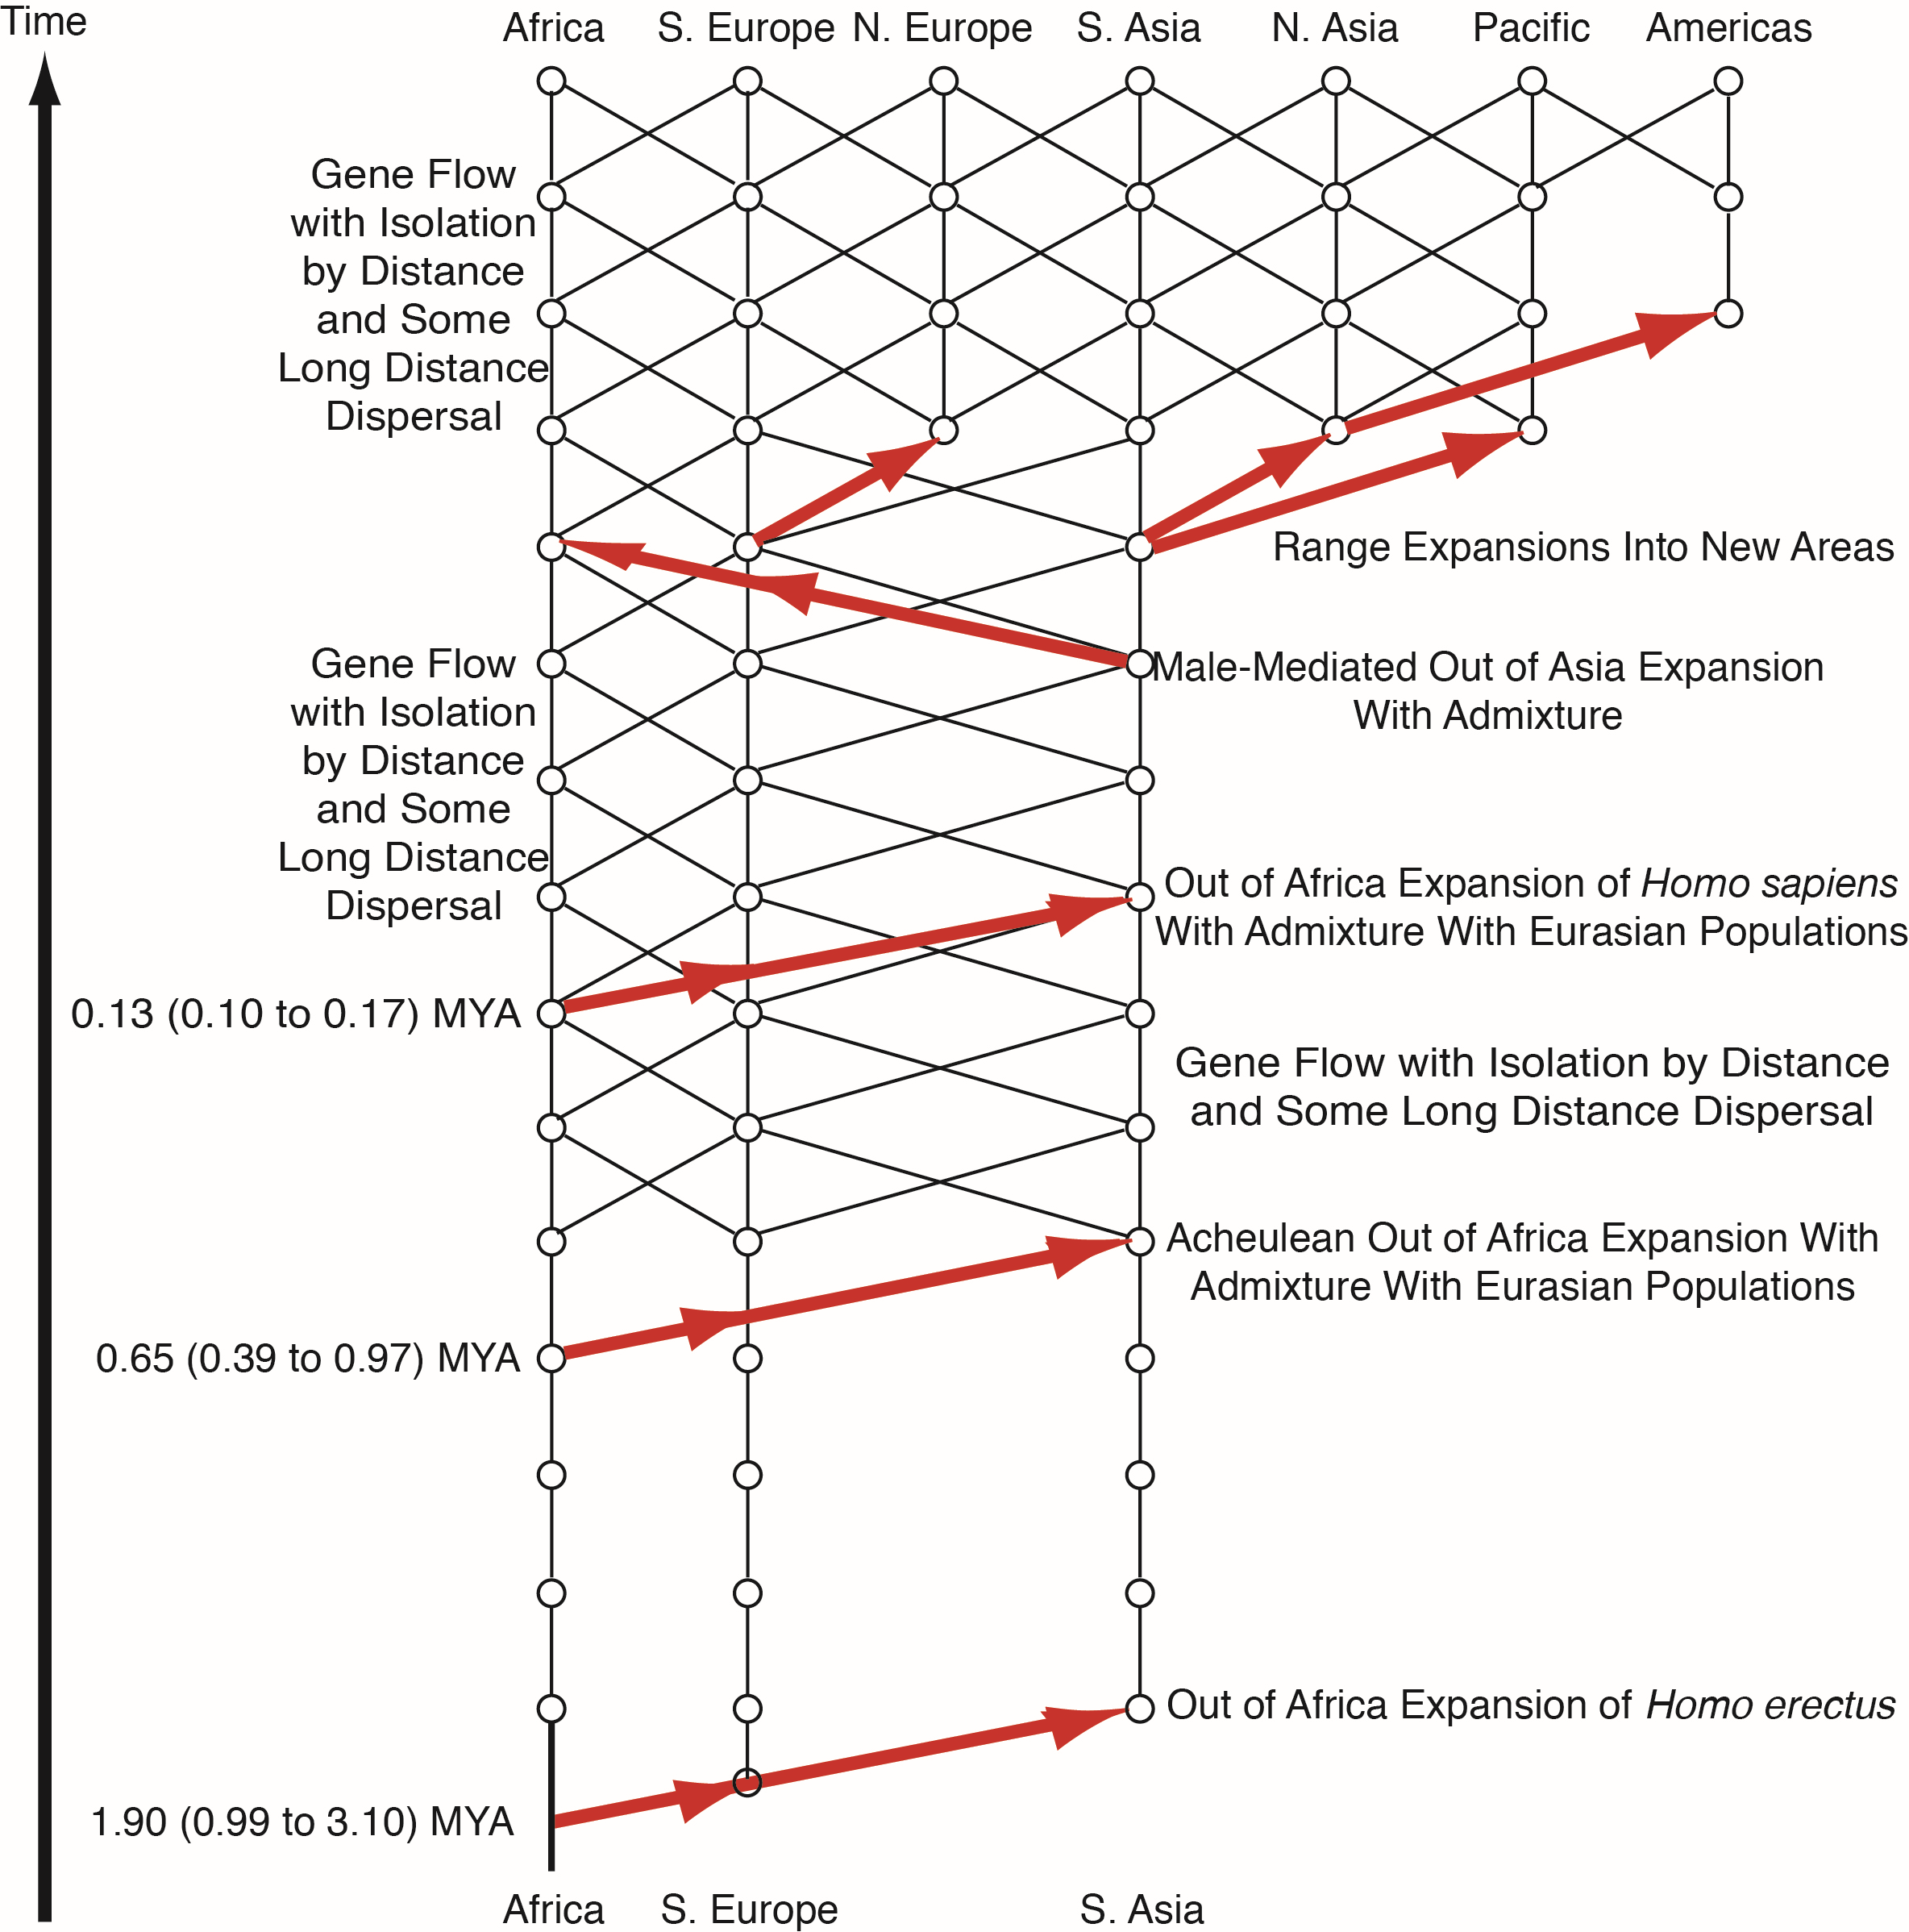
Because Cann et al. only falsified the candelabra model with no gene flow and not the true multiregional model with gene flow, the question therefore remained: is human evolution influenced primarily by splits, isolates, and extinction; or by gene flow? The first statistically significant discrimination between these two models was provided by nested clade phylogeographic analysis (NCPA) [12,13]. This form of analysis depends upon first estimating haplotype trees in genomic regions with little or no recombination using a Bayesian approach that quantifies the error in the tree estimates [14]. The estimated haplotype trees are then converted into nested groupings of clades (branches) that can incorporate the ambiguities revealed by the Bayesian estimator of the haplotype tree [14]. The nested design results in statistical independence of the nested blocks under the null hypothesis of no geographical associations, which allows a straightforward correction for multiple testing. Geographical data on each haplotype and clade are then overlayed upon the tree. The nested design provides a relative temporal dimension (which can be translated into a time dimension if a molecular clock is available), and the geographical data provides a spatial dimension. The spatial-temporal dynamics are then measured through a series of summary statistics that are tested for significance against the null hypothesis of no geographical association through permutation testing [15,16]. Inference about phylogeographic events and processes are then made from the statistically significant summary statistics. The inference pattern was validated by applying NCPA to 150 data sets from the literature in which strong a priori information existed about the true phylogeography [17]. This analysis revealed the accuracy of the inference method and the fact that multiple phylogeographic events or processes could be inferred from the same tree without interference. No other phylogeographic analytical technique has been subjected to such an intensive validation using actual data sets. The most common error found in this validation study was simply the failure to detect an event, so a multi-locus version of NCPA was developed to increase power and to provide further error reduction through a formal cross-validation procedure across loci with a log-likelihood ratio testing framework for both events and gene flow [12,13,18]. This multi-locus NCPA was applied to human evolution in 2002 using 10 unlinked genomic regions [12], later expanded to 25 unlinked genomic regions [13,18]. Figure 3 shows the results of the NCPA analysis. It is important to note that NCPA does not start with some a priori phylogeographic model, unlike most other phylogeographic techniques. Hence, the inference universe is not limited by the biases or areas of ignorance of the implementors of the analysis. Instead, the model emerges exclusively from statically significant, cross-validated hypotheses without any prior overall model or set of models. Hence, NCPA can reveal the unexpected.
Figure 3 reveals an unexpected model that is a hybrid between OAR (Figure 1A) and the multiregional model (Figure 1C) with a hint of the candelabra model in the early Pleistocene (Figure 1B). There is no statistically significant, cross-validated evidence for gene flow among the African and Eurasian populations after the initial expansion of Homo erectus out of Africa until the mid-Pleistocene. The failure to reject the null hypothesis of genetic isolation does not mean that there was no gene flow, only that we could not detect a significant signal that far back. Because only significant, cross-validated results are retained in NCPA, the initial regional populations after the expansion of Homo erectus are portrayed as isolates, as in the candelabra model. However, similarities to the candelabra model end drastically at the mid-Pleistocene at which there is a second major expansion of humans out of Africa that is associated with the expansion of the Acheulean tool-making culture out-of-Africa and into Eurasia [19]. Moreover, this expansion, probably a demic diffusion associated with a superior tool culture, involved statistically significant genetic interchange with the Eurasian populations. Also, recurrent gene flow under isolation-by-distance with some long-distance dispersal become established at the mid-Pleistocene and continues until the present day, including between Africa and Eurasia, although at a lesser rate. This is consistent with paleoclimatic data that reveal cycles of “green Sahara” that would eliminate the Sahara as a major obstacle to gene flow on a time scale measured in tens-of-thousands of years—the scale of resolution for NCPA that depends upon new mutational markers in the haplotype trees. Moreover, not a single significant, cross-validated fragmentation event (a split followed by isolation that also persisted for at least ten thousand years or more) is revealed in the areas inhabited by humans since the mid-Pleistocene. Hence, there are no splits or isolates or “pure” human populations since the time of the Acheulean expansion, at least at the resolution of tens-of-thousands of years. NCPA next reveals another major expansion of humans out-of-Africa during the late Pleistocene, and this one corresponds to the expansion posited by the OAR model. However, unlike the OAR model, this most recent expansion of humans out of Africa does not result in replacement but rather in a low but statistically significant rate of genetic interchange with the Eurasian populations, resulting in a “mostly out-of-Africa model” [12]. Following this third out-of-Africa expansion, there is further gene flow and population expansions resulting in genetic interchange and colonization of new areas to produce the current human gene pool and geographical distribution (Figure 3).
From an evolutionary perspective, there is a tremendous difference between a low rate of genetic interchange and none at all. The impact of gene flow depends upon both the rate of gene flow and the degree of allele frequency differences between the populations interchanging genes [19,20]. Given the general pattern for humans and many other species that allele frequency differences increase with increasing geographical distance, even small rates of genetic interchange between a population of sub-Saharan origin with populations in Eurasia could have important evolutionary impacts. This importance is amplified by a strong interaction of natural selection with genetic interchange between populations originally separated by long distances that shows that selection operates as a selective sieve in which some alleles are prevented from introgressing, other alleles increase in frequency more rapidly than the interchange rate due to positive selection, and yet other alleles simply reflect the introgression rate [19,21]. Ancient DNA (aDNA) studies have confirmed this pattern with the third out-of-Africa expansion and genetic interchange. Although many alleles from archaic Eurasians reflect a more uniform low rate of introgression, other areas of the genome in modern Eurasians are significantly devoid of archaic Eurasian genomic segments [22], whereas other archaic alleles have been selected for in response to adaptation to novel environments, such as the high altitude adaptations found in modern Tibetans with respect to the EPAS1 allele derived from Denisovans [23]. There is also no doubt that alleles or genome regions derived from archaic Eurasians influence many phenotypes and adaptations in modern humans [24–29], including widespread regulatory changes in non-coding DNA [30]. Hence, the genetic interchange between an expanding African population with archaic Eurasians has resulted in a genetic legacy that has been integrated into the current human gene pool [31]. The aDNA studies also strongly validated the conclusions from NCPA that the last out-of-Africa expansion shown in Figure 3 was accompanied by genetic interchange rather than complete replacement and that there was gene flow among ancient human populations [19].
Although the conclusions from NCPA are now widely accepted, they were extremely controversial when first published in Nature in 2002 [12], a time at which the OAR model was at the height of its popularity. It is therefore not surprising that this work was greeted with a highly negative reaction by much of the genetics community. Nine months after the publication of the Nature paper, Knowles and Maddison [32] presented simulation results that indicated that NCPA could not infer a particular phylogeographic situation and had a high false positive rate. Although the 2002 multilocus version of NCPA was made freely available to them, they only used the older 1995 single locus version of NCPA to analyze their simulations [32]. Moreover, they simulated a model of micro-vicariance in which a series of splits followed by isolation created a situation in which each sample came from an isolated population in their simulations. The situation of micro-vicariance was explicitly excluded from the inference structure of the single-locus NCPA (p. 773 in [17]) used by Knowles and Maddison. This insured that NCPA would do poorly in making inferences on a situation that it explicitly did not cover (unlike the 2002 version). Moreover, the splits involved large numbers of individuals and short times between the splits, thereby insuring much carry-over of ancestral polymorphisms across splits, making this a particularly difficult problem. Knowles and Maddison did mention in a single sentence that their own phylogeographic procedures displayed “poor performance” with these simulations, but provided no details. After the simulated data were made available to me, I reanalyzed the exact same simulations with the 2002 version of NCPA used in the Nature paper. NCPA fully inferred the simulated situation with 100% accuracy without a single type I or type II error [33]. Hence, the simulations of Knowles and Maddison actually reveal that the version of NCPA used to infer human evolution has great statistical power in inferring fragmentation events (splits followed by isolation) even in the difficult situation of short time intervals between splits and much carry over of ancestral polymorphism. Thus, the absence of inferred fragmentation events in human evolution since the mid-Pleistocene in Figure 3 is not due to low power (although the temporal resolution remains coarse with just 25 genomic regions).
Panchal and Beaumont [34] performed simulations on the multi-locus version of NCPA and also concluded a high rate of false positives (type I error). Table 1 gives a summary of their results. The corrected type I rate was set to 0.05 by the NCPA. As can be seen, the error rates for the events of contiguous range expansion, fragmentation (splits followed by isolation), and range expansion through long-distance colonization were all below 0.05, and in most cases far below. Indeed, the false positive rate for fragmentation events was always well below 0.05 in their simulations (Table 1). When this result is combined with the great statistical power for inferring fragmentation events shown by the simulations of Knowles and Maddison when analyzed with multi-locus NCPA, it reinforces that the conclusion from Figure 3 that fragmentation events lasting longer than tens of thousands of years are absent in the ancestral populations leading to modern humans since at least the mid-Pleistocene. Further note that all the false positives with a probability > 0.05 are associated with inferences of various types of gene flow. There is a straightforward reason for this: Panchal and Beaumont did not implement the cross-validation test for gene flow. Instead, they stated that gene flow inferences “are not subjected to further ‘cross-validation’ because there is no stipulation that the inferences should be concordant across time” (p. 418 in [34]). This statement is false for time intervals. Equation 12 in [35] gives such a cross-validation test for gene flow. Equation 2 in [18] gives a more refined likelihood-ratio test for cross-validating gene flow inferences, and this reference was cited by Panchal and Beaumont but ignored in their implementation of NCPA. When the cross-validation test for gene flow was applied to the human data analyzed for Figure 3, 8 inferences were dismissed as false positives, which would translate into a false positive probability of 0.421. Thus, the high false positive probabilities for gene flow inferences shown in Table 1 are simply an artefact of the false claim that a test for cross-validating gene flow inferences is not stipulated in NCPA—indeed it is. Thus, the simulations of Panchal and Beaumont [34] clearly show that all types of inferences in NCPA have low false positive rates when NCPA is actually implemented. All the gene flow inferences shown in Figure 3 have passed this cross-validation test, and therefore gene flow and genetic interchange with expanding populations has played an important role in human evolution since at least the mid-Pleistocene, whereas splits and isolation have played no detectable role at all during this time period.
Correcting the misleading conclusions published with these simulations is not just of historical interest but is of current importance because NCPA is still used for phylogeographic analyses. Edwards et al. [36] reviewed phylogeographic techniques, including NCPA, but accepted the simulations discussed above as showing that NCPA is subject to a high false positive rate. It is therefore important for current workers in the area of phylogeography to be informed that these simulations do not show a high false positive rate of NCPA when NCPA is properly implemented.
One legitimate limitation of NCPA is that is provides only a coarse model of phylogeographic history. As genomic techniques matured and were applied to human populations and fossils, new phylogeographic analyses and methods of historical reconstruction were developed that could provide much more detailed insight into human evolution, particularly for shallow time depths (mostly the last 100,000 years or so). Moreover, there was a significant change in how the multiregional model was presented even by advocates of OAR. Not surprisingly, Wolpoff and his collaborators objected to the misrepresentation of the multiregional model that occurred after Cann et al.’s 1987 paper, emphasizing the critical role that gene flow played in the multiregional model rather than the mislabeled candelabra model [37–42]. Eventually, even advocates of OAR began to include some gene flow in their depictions of multiregional evolution. For example, Fagundes et al. [43] used approximate Bayesian computation (ABC) to test OAR against some alternative models of human evolution. Although their alternatives had a tree-like structure, they did allow for gene flow between the branches. They concluded that a model that had a prior distribution on the amount of admixture (M) over the interval of 0 to 1 had a posterior probability that was three orders of magnitude smaller than that of the OAR model with M=0. Thus, in contrast to the NCPA, they concluded that there was statistically significant support for the OAR model. The whole philosophy behind a Bayesian analysis is to stay completely within the domain of probabilities, so this result was troubling because the general model in which admixture was possible over the 0 to 1 range was much less probable than the special case M=0. A necessary measure theoretic property of probabilities is that the probability of a special case must be less than or equal to the probability of the more general model within which the special case is nested. Fagundes et al. reported the opposite by three orders of magnitude, indicating that this is not just a case of sampling error. This serious violation of probability measure theory and formal logic is technically known as incoherence, and I [44] showed that this incoherence arose from using an equation for calculating model probabilities that assumes that the set of simulated models is exhaustive and mutually exclusive – neither of which is true. In contrast, the rejection of OAR in the NCPA was done through log-likelihood ratio tests, which are a coherent method for testing nested hypothesis. Coherent tests of nested hypothesis can also be performed within a Bayesian analysis. I therefore applied a well-established Bayesian test for nested hypotheses [45] to the posterior distribution estimated by Fagundes et al. for the M parameter. The nested Bayesian test led to a significant rejection (p < 0.025) of OAR—a coherent reversal of the relative probabilities of the models by 5 orders of magnitude using the same simulations that were given in [43]. Hence, a coherent Bayesian analysis yields the same results as NCPA: a rejection of OAR in favor of limited genetic interchange between the expanding out-of-Africa modern population with archaic Eurasian populations.
The other flaw in the equations used by Fagundes et al. [43] was their assumption that their models were exhaustive [44]. For example, none of the models simulated by Fagundes et al. included the mid-Pleistocene out of Africa expansion shown in Figure 3. Indeed, this statistically significant mid-Pleistocene out-of-Africa expansion was ignored in all the human evolution simulation models until a recent set of simulations performed by Ragsdale et al. [46]. Their simulations indicated a mid-Pleistocene expansion of an African population that later contributed to the evolution of anatomically modern humans within Africa. Their simulations showed that the Eurasian archaic population of Neanderthals (the only archaic population in their data set) was descended from this mid-Pleistocene out-of-Africa expansion. These results are completely concordant with the model shown in Figure 3. Ragsdale et al. also showed by simulating a broad range of models that inferences from simulations are extremely sensitive to the specific models being simulated. Hence, the posterior model probabilities given in Fagundes et al. are not probabilities of these models being true, but rather relative probabilities of these models to each other that could be changed radically by considering additional models. These observations suggest that NCPA and simulation models are not antagonistic to each other, but rather display a positive synergy. Simulations require the specification of a prior model with parameters, and this gives simulation approaches much great descriptive power as long as the simulated models include the major features in the population’s evolutionary history. In contrast, NCPA gives only a coarse description of evolutionary history, but creates a model directly out of statistically significant inferences without the use of any prior model. Hence, the two approaches can easily be combined, with NCPA providing an outline of the appropriate model universe and parametric approaches giving the details and greater power to distinguish among alternative parameterizations [47].
My critique of the ABC analysis [43] has often been misinterpreted as an attack against Bayesian statistics in general [48,49]. First, as already noted previously, the first step in NCPA is a Bayesian estimation of the haplotype trees and quantification of possible errors [14]. NCPA is not anti-Bayesian as it uses Bayesian statistics in its first step that determines all subsequent inferences. Second, my critique of Fagundes et al. was not a critique of Bayesian statistics in general; rather, it was a critique of the mathematical mistakes made in that paper that resulted in incoherent inference. I show in that same paper that coherent Bayesian approaches that have been around since the 1960’s are available that eliminate this problem. The coherent approach is 100% Bayesian, and indeed uses exactly the same simulations and estimated posteriors on parameters that were generated by Fagundes et al.
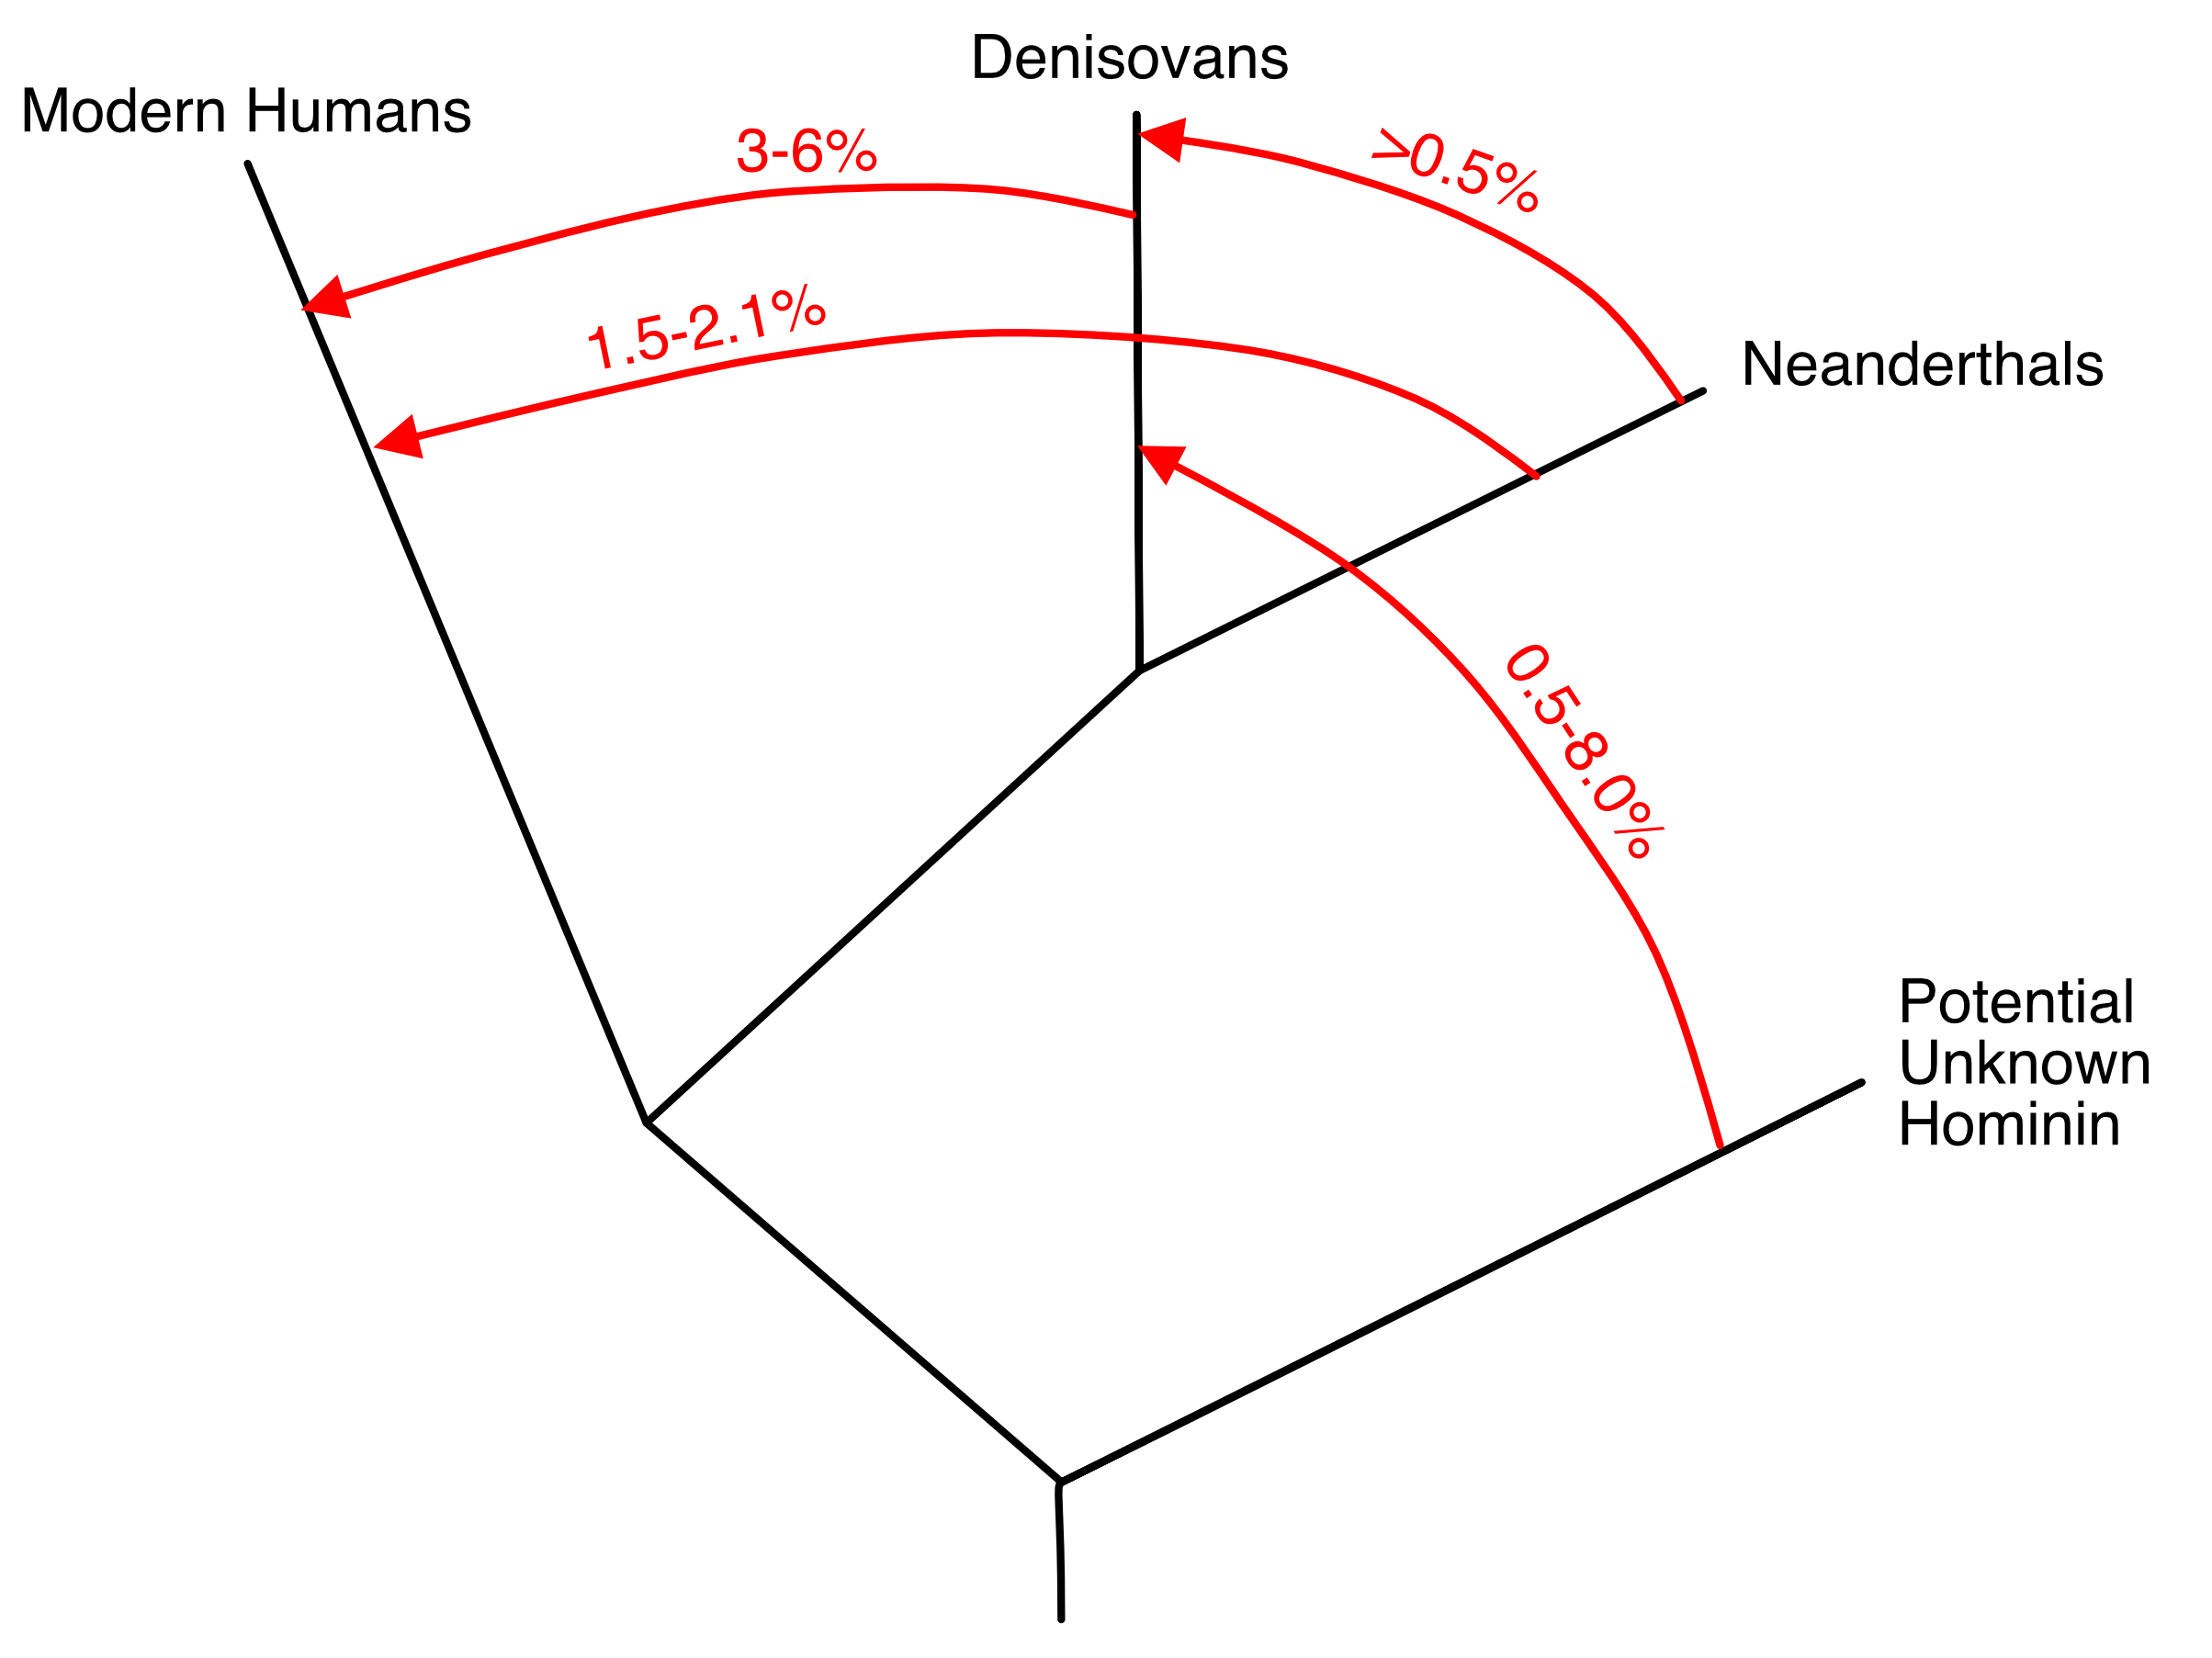
Many other approaches to testing the hypothesis of genetic interchange have been proposed in our current genomic era, as reviewed in Chapter 7 in [20]. As already mentioned, aDNA studies have confirmed the most controversial conclusion from NCPA that there was limited genetic interchange between the expanding out-of-Africa population with Eurasian populations. Moreover, genomic studies have revealed much genetic interchange and movement of human populations over the last 100,000 years, as reviewed in [19]. One common method for achieving such inferences is to assume an evolutionary tree for the populations being sampled, and then calculate from the sequence data various statistical tests such as ABBA/BABA [50] or several other alternatives (reviewed in Chapters 7 of [19,20]). These statistics are tests of the null hypothesis that the underlying data do indeed come from a tree of populations. Rejection of this null hypothesis indicates that genetic interchange occurred that violated the assumed tree-like structure. When these tests reject a tree-like structure, often an admixture event of genetic interchange is assumed to have occurred to explain the rejection of the null hypothesis of a tree. For example, Figure 4, a simplified version of Figure 8 from [51], presents a typical visualization of this type of analysis. There are two serious problems with this analytical approach. First, these test statistics have an identifiability problem as they cannot distinguish between a single, virtually instantaneous admixture event, versus multiple, recurring admixture events, versus continuous gene flow, or versus gene flow with isolation by distance [52–54]. Hence, figures such as Figure 4 are visually misleading as they imply a degree of knowledge that is not truly available from the test results. Drawing a trellis between populations with gene flow would have been equally justified for Figure 4. Other workers [55–57] have used fossils from different time periods and/or analytical techniques that make use of the length of introgressed genomic segments to infer recurrent and frequent genetic interchange between Neanderthals and modern humans in Eurasia from 100,000 ybp to 37,000 ybp, and perhaps as far back as 270,000 ybp [58]. Hence, Figure 4 is not only visually misleading, it displays a false narrative for Neanderthals and modern humans. The only conclusion that is justifiable from these ABBA/BABA and similar analyses is the falsification of the null hypothesis that these populations are interrelated through an evolutionary tree. The null hypothesis of human population evolutionary trees has been falsified again and again since the mid-Pleistocene (as reviewed in Chapter 7 in [19]), and this is not surprising as NCPA already indicated that since the mid-Pleistocene human population structure has been dominated by population movements and/or individual dispersal coupled with interbreeding, with no significant role for splits and isolation (Figure 3).
The second and more serious reason why figures such as Figure 4 are misleading is that the analytical method of starting with a tree and then adding connections to reflect gene flow is that this approach is statistically inconsistent when the actual relationship of the populations is a more complicated network than a simple tree [59,60]. Statistical inconsistency means that the estimators do not converge to the true answer with increasing amounts of data; indeed, the more data you have, the more likely you will have the wrong answer. Patently, inconsistency, just like incoherence, is a highly undesirable statistical property. This inconsistency is illustrated by the work of Pugach et al. [61]. They analyzed genomic data from Siberian populations for which some prior demographic historical information was available. Using the TreeMix program that starts with an evolutionary tree of the populations followed by adding on admixture events as needed, they found that the “TreeMix results were not easy to interpret and seem to contradict well-accepted aspects of human population history.” They then analyzed the same data with SpaceMix, a program that does not assume an underlying evolutionary tree. In contrast to TreeMix, the SpaceMix results fit the genomic data better and without contradictions to well-accepted aspects of the population history. SpaceMix indicated a history that included isolation by distance, long-distance dispersals, and multiple admixture events – all of which violate the assumption of a population evolutionary tree. Because of inconsistency, the credibility of figures such as Figure 4 is highly questionable in human evolutionary studies.
Despite the almost universal rejection of tree-like structures in human evolution since the mid-Pleistocene, some workers in this area still construct population trees using programs that will always generate a tree no matter how bad the fit is to a tree, treating each human population as an isolate on its own branch of the tree without any indication of any genetic interchange between branches (e.g., [62,63]). These population trees are typically presented without any statistical assessment of how well the tree fits the underlying genetic data. I tested the tree given in [63], and rejected a tree-like structure with a p-value < 10-200 [20]. To say the least, this is an abysmal fit, and the utility of such poor-fitting trees to gain insight into human evolution and population structure is highly questionable.
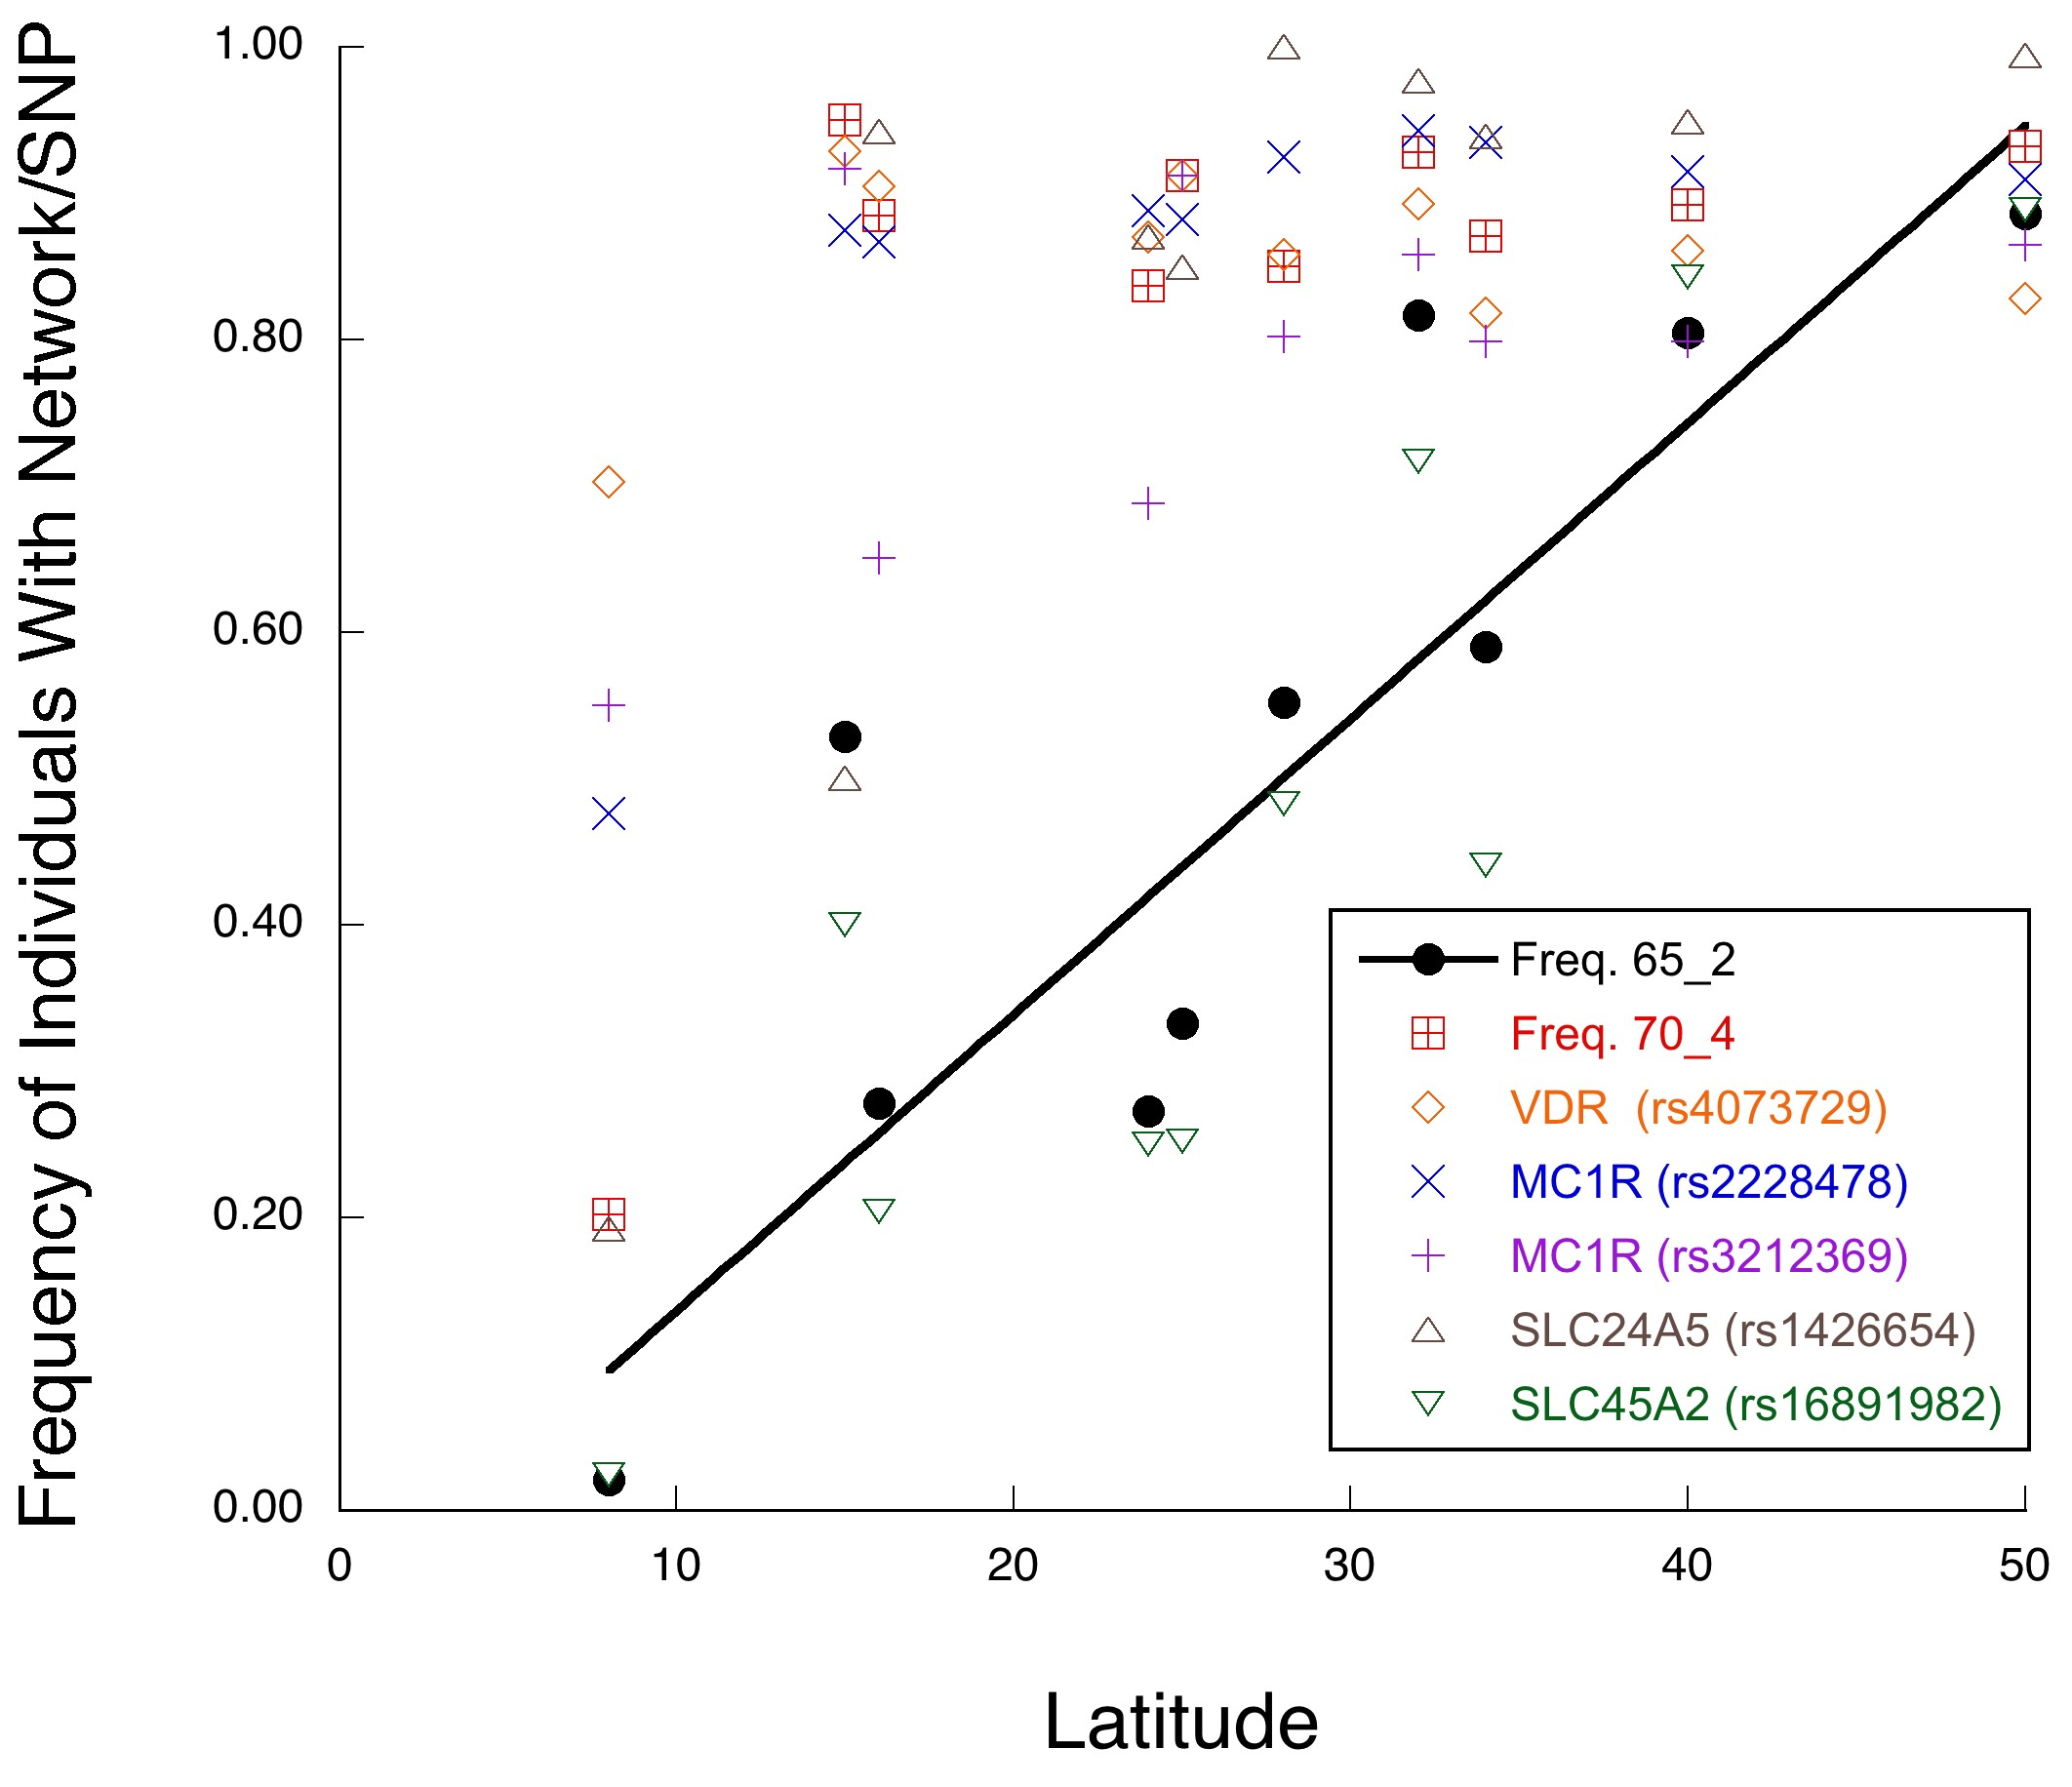
The above discussion has a direct impact on the debate about the existence of races in humans. Race is not a well-defined concept in evolutionary biology, but is often used as a synonym for subspecies. The 1972 Endangered Species Act provides for the protection of vertebrate subspecies as well as species, so there has been much effort to define subspecies using modern systematics and genetics in the area of conservation biology. In order to avoid a human bias, I have used the definitions of race or subspecies that are now commonly applied to non-human organisms [19,64–67]. Perhaps the best and most objective of these definitions of subspecies is that subspecies are geographical populations within a species that evolve as separate evolutionary lineages with sharp genetic and phenotypic geographical boundaries because of highly restricted gene flow with other populations in the same species. Indeed, this is the definition of a fragmentation event in NCPA that also allows some highly restricted gene flow after the fragmentation event. For example, when NCPA was applied to African elephants for five genomic regions showing no recombination, all five regions inferred a significant fragmentation event between savanna versus forest populations that split 4.2 million years ago [18,20]. However, four out of the five regions also showed limited but significant genetic interchange after this split, with mtDNA displaying the most genetic interchange. This inference is confirmed by other genetic surveys and observations of a narrow hybrid zone and introgression, particularly of mtDNA, in areas where the savanna and forest habitats interdigitate [20]. Similarly, our sister species, the common chimpanzee (Pan troglydytes), has three evolutionary lineages among its five classically named subspecies, but once again with highly restricted gene flow and narrow hybrid zones between them [66]. As shown in Figure 3, there are no such fragmentation events in human evolutionary history since the mid-Pleistocene. In contrast, there is highly significant evidence of considerable genetic interchange among African and Eurasian populations during this same time frame. Instead of observing the required sharply defined geographical boundaries between lineages within humans, we see geographical clines and intermediates. For example, skin color has often been used to define human races, but skin color variation has long been known to be clinal in nature, following a latitudinal gradient [19]. The phenotypic clines in skin color are also observed at the genetic level when a multi-locus approach is used that incorporates interactions among loci [68] (Figure 5). Thus, there are no races or subspecies in humans, unlike our sister species the common chimpanzee [19].
Despite the extensive evidence for gene flow and the lack of evidence of highly isolated evolutionary lineages, much of the human evolutionary literature is still full of “splits’, “divergence times of populations”, and pictures of human evolutionary trees showing separate branches leading to modern day Europeans, Asians, and Africans [19]. These “splits”, “divergence times”, and “trees” are typically estimated with computer programs that will automatically yield a population tree regardless of whether or not the underlying data has a tree-like structure. There are now several tests for such a tree-like data structure, so modern researchers can now answer Peter Smouse’s famous question, “To Tree or Not To Tree: That is the Question” [69]. As shown above, the answer to Peter Smouse’s question is an overwhelming “not to tree” [19,20]. These trees and splits are therefore not justifiable scientifically. A panel assembled by the USA National Academy of Sciences [70] has concluded that such scientifically inaccurate descriptors can have negative societal connotations about race. Researchers in human genetics and evolution should be careful about how they phrase and graphically depict their results. If a research group decides to portray human populations as having split from one another or as defining separate branches on an evolutionary tree of populations, then that group should provide the statistical test results to justify a tree-like structure in their data. Testing testable assumptions is simply good science.
Declarations
Competing Interests
Alan R. Templeton is a member of the Advisory Board of the journal Human Population Genetics and Genomics. The author was not involved in the journal’s review of or decisions related to this manuscript. The author has declared that no other competing interests exist.
Acknowledgement
This paper is dedicated to the memory of Dr. Garland Allen, a dear friend and long-time collaborator on the topics of race and eugenics. I also thank three anonymous reviewers who had many excellent suggestions for improving this paper.
Abbreviations
The following abbreviations are used in this manuscript:
- aDNA:
- Ancient DNA
- NCPA:
- Nested Clade Phylogeographic Analysis
- mtDNA:
- Mitochondrial DNA
- OAR:
- Out of Africa Replacement
- SNP:
- Single Nucleotide Polymorphism
Table 1 The probabilities of false positives under multi-locus, nested-clade, phylogeographic analysis of five loci under four different models of gene flow in the simulations of Panchal and Beaumont (2010).
| Model |
IBD |
IBD+LDD |
CRE |
FRAG |
LDC |
| Panmictic |
0.1639 |
0.0042 |
0.0028 |
0.0000 |
0.0000 |
| IBD |
– |
0.2792 |
0.0278 |
0.0028 |
0.0031 |
| IBD+LDD |
– |
– |
0.0406 |
0.0021 |
0.0021 |
| Island |
0.5306 |
– |
0.0368 |
0.0007 |
0.0014 |
Note: The simulated gene flow models are panmictic, isolation-by-distance (IBD), isolation-by-distance plus long-distance dispersal (IBD+LDD), and the Island model (which has LDD). The events include contiguous range expansion (CRE), allopatric fragmentation (FRAG), and range expansion through long-distance colonization (LDC).
References
| 1. |
Rightmire GP. Homo sapiens in Sub-Saharan Africa. In: The Origins Of Modern Humans: A World Survey Of The Fossil Evidence. In: Smith FH, Spencer F, editor. New York: Liss; 1984. p.295-326.
|
| 2. |
Coon CS. The Origin of Races. New York: Knopf; 1962.
|
| 3. |
Weidenreich F. Some problems dealing with ancient man. Am Anthropol. 1940;42:375-383.
[Google Scholar]
|
| 4. |
Weidenreich F. Apes, Giants, and Man. Chicago: University of Chicago Press; 1946. 122 p.
|
| 5. |
Dobzhansky T. On species and races of living and fossil man. Am J Phys Anthropol. 1944;2(3):251-265.
[Google Scholar]
|
| 6. |
Cann RL, Stoneking M, Wilson AC. Mitochondrial DNA and human evolution. Nature. 1987;325:31-36.
[Google Scholar]
[CrossRef]
|
| 7. |
Wolpoff MH, Wu XZ, Thorne AG. Modern Homo sapiens origins: a general theory of hominid evolution involving the fossil evidence from East Asia. In: The Origins of Modern Humans: A World Survey of the Fossil Evidence. In: Smith FH, Spencer F, editor. New York: Alan R. Liss; 1984. p.411-483.
|
| 8. |
Templeton AR. Perspective: Genetics and recent human evolution. Evolution. 2007;61(7):1507-1519.
[Google Scholar]
[CrossRef]
|
| 9. |
Templeton AR. The “Eve” hypothesis: a genetic critique and reanalysis. Amer Anthropol. 1993;95:51-72.
[Google Scholar]
[CrossRef]
|
| 10. |
Templeton AR. Cambridge, Massachusetts: MIT Press; 2018. p.109-128.
|
| 11. |
Lewin R. Human Evolution: An Illustrated Introduction. London: Blackwell Scientific Publications; 1989.
|
| 12. |
Templeton AR. Out of Africa again and again. Nature. 2002;416(6876):45-51.
[Google Scholar]
[CrossRef]
|
| 13. |
Templeton AR. Haplotype trees and modern human origins. Am J Phys Anthropol. 2005;128(S41):33-59.
[Google Scholar]
[CrossRef]
|
| 14. |
Templeton AR, Crandall KA, Sing CF. A cladistic analysis of phenotypic associations with haplotypes inferred from restriction endonuclease mapping and DNA sequence data. III. Cladogram estimation. Genetics. 1992;132:619-633.
[Google Scholar]
[CrossRef]
|
| 15. |
Templeton AR, Routman E, Phillips C. Separating population structure from population history: a cladistic analysis of the geographical distribution of mitochondrial DNA haplotypes in the Tiger Salamander, Ambystoma tigrinum. Genetics. 1995;140:767-782.
[Google Scholar]
[CrossRef]
|
| 16. |
Posada D, Crandall KA, Templeton AR. Nested clade analysis statistics. Mol Ecol Notes. 2006;6(3):590-593.
[Google Scholar]
[CrossRef]
|
| 17. |
Templeton AR. Statistical phylogeography: methods of evaluating and minimizing inference errors. Mol Ecol. 2004;13(4):789-809.
[Google Scholar]
[CrossRef]
|
| 18. |
Templeton AR. Statistical hypothesis testing in intraspecific phylogeography: nested clade phylogeographical analysis vs. approximate Bayesian computation. Mol Ecol. 2009;18(2):319-331.
[Google Scholar]
[CrossRef]
|
| 19. |
Templeton AR. Human Population Genetics and Genomics. Oxford: Academic Press/Elsevier; 2019. 498 p.
|
| 20. |
Templeton AR. Population Genetics and Microevolutionary Theory. Oxford: Wiley-Blackwell; 2021. 768 p.
|
| 21. |
Cuadros-Espinoza S, Laval G, Quintana-Murci L, Patin E. The genomic signatures of natural selection in admixed human populations. Am J Hum Genet. 2022;109(4):710-726.
[Google Scholar]
[CrossRef]
|
| 22. |
Skov L, Coll Macià M, Lucotte EA, Cavassim MIA, Castellano D, Schierup MH, et al. Extraordinary selection on the human X chromosome associated with archaic admixture. Cell Genomics. 2023;3(3):100274.
[Google Scholar]
[CrossRef]
|
| 23. |
Wang H, Yang MA, Wangdue S, Lu H, Chen H, Li L, et al. Human genetic history on the Tibetan Plateau in the past 5100 years. Sci Adv. 2023;9(11):eadd5582.
[Google Scholar]
[CrossRef]
|
| 24. |
Dannemann M, Milaneschi Y, Yermakovich D, Stiglbauer V, Kariis HM, Krebs K, et al. Neandertal introgression partitions the genetic landscape of neuropsychiatric disorders and associated behavioral phenotypes. Transl Psychiatry. 2022;12(1):433.
[Google Scholar]
[CrossRef]
|
| 25. |
Kerner G, Patin E, Quintana-Murci L. New insights into human immunity from ancient genomics. Curr Opin Immunol. 2021;72:116-125.
[Google Scholar]
[CrossRef]
|
| 26. |
Reilly PF, Tjahjadi A, Miller SL, Akey JM, Tucci S. The contribution of Neanderthal introgression to modern human traits. Curr Biol. 2022;32(18):R970-R983.
[Google Scholar]
[CrossRef]
|
| 27. |
Vespasiani DM, Jacobs GS, Cook LE, Brucato N, Leavesley M, Kinipi C, et al. Denisovan introgression has shaped the immune system of present-day Papuans. PLOS Genetics. 2022;18(12):e1010470.
[Google Scholar]
[CrossRef]
|
| 28. |
Yair S, Lee KM, Coop G. The timing of human adaptation from Neanderthal introgression. Genetics. 2021;218(1):iyab052.
[Google Scholar]
[CrossRef]
|
| 29. |
Zeberg H, Pääbo S. A genomic region associated with protection against severe COVID-19 is inherited from Neandertals. Proc Natl Acad Sci USA. 2021;118(9):e2026309118.
[Google Scholar]
[CrossRef]
|
| 30. |
Yermakovich D, Pankratov V, Võsa U, Yunusbayev B, Team EBR, Dannemann M. Long-range regulatory effects of Neandertal DNA in modern humans. Genetics. 2022;223(3):iyac188.
[Google Scholar]
[CrossRef]
|
| 31. |
Ahlquist KD, Bañuelos MM, Funk A, Lai J, Rong S, Villanea FA, et al. Our Tangled Family Tree: New Genomic Methods Offer Insight into the Legacy of Archaic Admixture. Genome Biol Evol. 2021;13(7):evab115.
[Google Scholar]
[CrossRef]
|
| 32. |
Knowles LL, Maddison WP. Statistical phylogeography. Mol Ecol. 2002;11(12):2623-2635.
[Google Scholar]
[CrossRef]
|
| 33. |
Templeton AR. Why does a method that fails continue to be used: the answer. Evolution. 2009;63(4):807-812.
[Google Scholar]
[CrossRef]
|
| 34. |
Panchal M, Beaumont MA. Evaluating nested clade phylogeographic analysis under models of restricted gene flow. Syst Biol. 2010;59(4):415-432.
[Google Scholar]
[CrossRef]
|
| 35. |
Templeton AR. A maximum likelihood framework for cross validation of phylogeographic hypotheses In: Evolutionary Theory and Processes: Modern Horizons. In: Wasser SP, editor. Dordrecht, The Netherlands: Kluwer Academic Publishers; 2004. p.209-230.
|
| 36. |
Edwards SV, Robin VV, Ferrand N, Moritz C. The Evolution of Comparative Phylogeography: Putting the Geography (and More) into Comparative Population Genomics. Genome Biol Evol. 2021;14(1):evab176.
[Google Scholar]
[CrossRef]
|
| 37. |
Wolpoff MH, Spuhler JN, Smith FH, Radovcic J, Pope G, Frayer DW, et al. Modern human origins. Science. 1988;241(4867):772-774.
[Google Scholar]
[CrossRef]
|
| 38. |
Wolpoff M, Thorne A. The case against Eve. New Scientist. 1991;22:37-41.
[Google Scholar]
[CrossRef]
|
| 39. |
Frayer DW, Wolpoff MH, Thorne AG, Smith FH, Pope GG. Theories of modern human origins: the paleontological test. Am Anthropol. 1993;95:14-50.
[Google Scholar]
[CrossRef]
|
| 40. |
Wolpoff M, Thorne AG, Smith FH, Frayer DW, Pope GG. Multiregional Evolution: A World-Wide Source for Modern Human Populations In: Origins of anatomically modern humans. In: Nitecki MH, Nitecki DV, editor. New York: Plenum Press; 1994. p.175-200.
|
| 41. |
Wolpoff MH. Interpretations of Multiregional Evolution. Science. 1996;274(5288):704-706.
[Google Scholar]
[CrossRef]
|
| 42. |
Wolpoff MH, Hawks J, Caspari R. Multiregional, not multiple origins. Am J Phys Anthropol. 2000;112(1):129-136.
[Google Scholar]
[CrossRef]
|
| 43. |
Fagundes NJR, Ray N, Beaumont M, Neuenschwander S, Salzano FM, Bonatto SL, et al. Statistical evaluation of alternative models of human evolution. Proc Natl Acad Sci USA. 2007;104(45):17614-17619.
[Google Scholar]
[CrossRef]
|
| 44. |
Templeton AR. Coherent and incoherent inference in phylogeography and human evolution. Proc Natl Acad Sci USA. 2010;107(14):6376-6381.
[Google Scholar]
[CrossRef]
|
| 45. |
Lindley DV. Introduction to Probability and Statistics from a Bayesian Viewpoint. Cambridge: Cambridge University Press; 1965.
|
| 46. |
Ragsdale AP, Weaver TD, Atkinson EG, Hoal EG, Möller M, Henn BM, et al. A weakly structured stem for human origins in Africa. Nature. 2023;617:755-763.
[Google Scholar]
[CrossRef]
|
| 47. |
Strasburg JL, Kearney M, Moritz C, Templeton AR. Combining phylogeography with distribution modeling: multiple Pleistocene range expansions in a parthenogenetic gecko from the Australian arid zone. PLoS ONE. 2007;2(8):e760.
[Google Scholar]
[CrossRef]
|
| 48. |
Arroyo-Santos A, Olson ME, Vergara-Silva F. The phylogeography debate and the epistemology of model-based evolutionary biology. Biol Philos. 2014;29(6):833-850.
[Google Scholar]
[CrossRef]
|
| 49. |
Beaumont MA, Nielsen R, Robert C, Hey J, Gaggiotti O, Knowles L, et al. In defence of model-based inference in phylogeography. Mol Ecol. 2010;19(3):436-446.
[Google Scholar]
[CrossRef]
|
| 50. |
Green RE, Krause J, Briggs AW, Maricic T, Stenzel U, Kircher M, et al. A draft sequence of the Neandertal genome. Science. 2010;328(5979):710-722.
[Google Scholar]
[CrossRef]
|
| 51. |
Prufer K, Racimo F, Patterson N, Jay F, Sankararaman S, Sawyer S, et al. The complete genome sequence of a Neanderthal from the Altai Mountains. Nature. 2014;505(7481):43-49.
[Google Scholar]
[CrossRef]
|
| 52. |
Durand EY, Patterson N, Reich D, Slatkin M. Testing for ancient admixture between closely related populations. Mol Biol Evol. 2011;28(8):2239-2252.
[Google Scholar]
[CrossRef]
|
| 53. |
Eriksson A, Manica A. The doubly conditioned frequency spectrum does not distinguish between ancient population structure and hybridization. Mol Biol Evol. 2014;31(6):1618-1621.
[Google Scholar]
[CrossRef]
|
| 54. |
Peter BM. Admixture, population structure, and f-statistics. Genetics. 2016;202(4):1485-1501.
[Google Scholar]
[CrossRef]
|
| 55. |
Fu Q, Hajdinjak M, Moldovan OT, Constantin S, Mallick S, Skoglund P, et al. An early modern human from Romania with a recent Neanderthal ancestor. Nature. 2015;524(7564):216-219.
[Google Scholar]
[CrossRef]
|
| 56. |
Kuhlwilm M, Gronau I, Hubisz MJ, de Filippo C, Prado-Martinez J, Kircher M, et al. Ancient gene flow from early modern humans into Eastern Neanderthals. Nature. 2016;530(7591):429-433.
[Google Scholar]
[CrossRef]
|
| 57. |
Seguin-Orlando A, Korneliussen TS, Sikora M, Malaspinas A-S, Manica A, Moltke I, et al. Genomic structure in Europeans dating back at least 36,200 years. Science. 2014;346(6213):1113-1118.
[Google Scholar]
[CrossRef]
|
| 58. |
Posth C, Wissing C, Kitagawa K, Pagani L, van Holstein L, Racimo F, et al. Deeply divergent archaic mitochondrial genome provides lower time boundary for African gene flow into Neanderthals. Nat Commun. 2017;8:16046.
[Google Scholar]
[CrossRef]
|
| 59. |
Solís-Lemus C, Yang M, Ané C. Inconsistency of species tree methods under gene flow. Syst Biol. 2016;65(5):843-851.
[Google Scholar]
[CrossRef]
|
| 60. |
Wen D, Nakhleh L. Coestimating reticulate phylogenies and gene trees from multilocus sequence data. Syst Biol. 2018;67(3):439-457.
[Google Scholar]
[CrossRef]
|
| 61. |
Pugach I, Matveev R, Spitsyn V, Makarov S, Novgorodov I, Osakovsky V, et al. The complex admixture history and recent southern origins of Siberian populations. Mol Biol Evol. 2016;33(7):1777-1795.
[Google Scholar]
[CrossRef]
|
| 62. |
Mallick S, Li H, Lipson M, Mathieson I, Gymrek M, Racimo F, et al. The Simons Genome Diversity Project: 300 genomes from 142 diverse populations. Nature. 2016;538(7624):201-206.
[Google Scholar]
[CrossRef]
|
| 63. |
Hunley KL, Cabana GS, Long JC. The apportionment of human diversity revisited. Am J Phys Anthropol. 2016;160(4):561-569.
[Google Scholar]
[CrossRef]
|
| 64. |
Templeton AR. Human races: A genetic and evolutionary perspective. Am Anthropol. 1998;100(3):632-650.
[Google Scholar]
[CrossRef]
|
| 65. |
Templeton AR. Human races in the context of recent human evolution: a molecular genetic perspective In: Genetic Nature/Culture. In: Goodman AH, Heath D, Lindee MS, editor. Berkeley: University of California Press; 2003. p.234-257.
|
| 66. |
Templeton AR. Biological races in humans. Stud Hist Philos Biol Biomed Sci. 2013;44(3):262-271.
[Google Scholar]
[CrossRef]
|
| 67. |
Templeton AR. Evolution and notions of human race In: How Evolution Shapes Our Lives: Essays on Biology and Society. In: Losos JB, Lenski RE, editor. Princeton and Oxford: Princeton University Press; 2016. p.346-361.
|
| 68. |
Tiosano D, Audi L, Climer S, Zhang W, Templeton AR, Fernández-Cancio M, et al. Latitudinal clines of the human vitamin D receptor and skin color genes. G3. 2016;6(5):1251-1266.
[Google Scholar]
[CrossRef]
|
| 69. |
Smouse PE. To tree or not to tree. Mol Ecol. 1998;7(4):399-412.
[Google Scholar]
[CrossRef]
|
| 70. |
National Academies of Sciences, Engineering and Medicine. Using Population Descriptors in Genetics and Genomics Research: A New Framework for an Evolving Field. Washington, DC: The National Academies Press; 2023.
|