
Human Population Genetics and Genomics ISSN 2770-5005
Human Population Genetics and Genomics 2023;3(3):0006 | https://doi.org/10.47248/hpgg2303030006
Original Research Open Access
Changes in human effective population size overlap the beginning and end of a critical time in European medieval history, also characterized by the Black Death epidemic
Massimo Mezzavilla
1,†
,
Federico De Pizzol
1,†
,
Leonardo Vallini
1
,
Irene Barbiera
2
,
Alessio Boattini
3
,
Cristian Taccioli
4,†
 ,
Luca Pagani
1,5,†
,
Luca Pagani
1,5,†
Correspondence: Cristian Taccioli
Academic Editor(s): Joshua Akey
Received: May 12, 2023 | Accepted: Jul 13, 2023 | Published: Aug 16, 2023
© 2023 by the author(s). This is an Open Access article distributed under the Creative Commons License Attribution 4.0 International (CC BY 4.0) license, which permits unrestricted use, distribution and reproduction in any medium or format, provided the original work is correctly credited.
Cite this article: Mezzavilla M, De Pizzol F, Vallini L, Barbiera I, Boattini A, Taccioli C, Pagani L. Changes in human effective population size overlap the beginning and end of a critical time in European medieval history, also characterized by the Black Death epidemic. Hum Popul Genet Genom 2023; 3(3):0006. https://doi.org/10.47248/hpgg2303030006
The intersection of historiography and archaeology has long pondered over the impact of known historical events on census size. In recent times, genetic methods have successfully traced changes over time in the genetic size of a given population. Moreover, the correlation between genetic and census sizes of a population is contingent on several demographic assumptions that are relatively simple for our species.
Our research endeavours to examine the changes in effective population size (Ne) in all human populations in the 1000 Genomes Project over the past two millennia. We compared our findings with estimates from historical censuses where available. Our investigation confirms what was already observed in France and reveals a common pattern found in most European populations, which manifests as a drastic population decrease beginning around the year 1300 and growth after the year 1600. This profile aligns well with known wars, famines, and epidemics that characterized these trying times in Europe. The most notable among them being the second plague epidemic, caused by Y. pestis, which in Europe commenced in 1347/8 and is also known as the "Black Death".
Our findings demonstrate that changes in genetic population size through time can serve as a dependable proxy for census size, which is independent of potential biases in the written historical record. Consequently, we provide a robust estimate of the impact caused by the population crisis that followed the year 1300 on the European genomic landscape in light of previous results. Our study offers a new paradigm for interpreting the past and underscores the potential of genetic methods in reconstructing historical events.
Keywordseffective population size, census size, Black Death, Plague
Effective population size (Ne), a staple of classical population genetic theory that measures genetic diversity within a population, has experienced recent popularity as a measure of genetic population size by virtue of increasing availability of whole genome sequences for a number of human and non-human populations. Measuring changes in Ne over time has proven to be a valuable resource for investigating both recent and ancient demographic historical events providing an indirect means of assessing changes in population size [1,2]. These changes are known to be related to various stressors such as environment, migration, famine, and pathogens, and have been reported to correspond with historical census sizes (Nc): the actual number of individuals in a population at a given time, in numerous human groups [3–5]. In light of this proxy role of Ne for Nc, examining changes in a population from a genetic perspective is particularly valuable since historical sources on demographic dynamics are extremely limited for periods preceding the 17th century CE.
Recently, several methods have been developed to estimate Ne from genomic data, some more directed towards the deep past (PSMC [6], MSMC [7], typically inspecting hundreds or thousands of generations ago) and other towards historical events (IBDNe [4,8], aimed at making inferences in the last 100 generations or so). The advantage of the latter is that it specifically targets recent times, hence its genetic based inference can be aligned against known historical events to assess the actual genetic impact of known or yet to be discovered historical demographic changes. The IBDNe analysis estimates historical effective population size using as input the identity-by-descent (IBD) DNA segments from modern human genomes and is deemed reliable when at least around 100 genomes per population are used [8]. So, on one hand one can estimate the change in census size via historical sources, while on the other it is possible to complement this knowledge by assessing the actual impact on the genetic diversity of this drop or growth of population size. Remarkably, despite such methods having been available for almost a decade, we still lack a detailed understanding of the Ne trajectories for most of the populations that represent human genetic diversity worldwide, several of which are included in the iconic 1000 Genomes Project [9] that made publicly available more than 3000 full human genomes. Here we set out to provide a global representation of Ne changes over time in the whole 1000 Genome panel in the past 4000 years. Furthermore, given the more abundant availability of historical Nc for the European populations included in the panel, we will also focus on them as case studies to better understand the relationship between Ne and Nc in human populations, ultimately providing a way to estimate the genetic effect of known historical events.
Genomic data from the 1000 genome project was downloaded from http://ftp.1000genomes.ebi.ac.uk/vol1/ftp/data_collections/1000G_2504_high_coverage/working/phase3_liftover_nygc_dir/. A Principal Component Analysis has been made for each population using PLINK v1.90b6.24 [10] using the function PCA. Principal component analyses were performed after linkage disequilibrium pruning (r2 > 0.4) and removal of markers with MAF < 0.05. Then we proceeded to remove outlier individuals, i.e., those that showed a distance from the mean higher than 3 standard deviations. This procedure was applied for each population independently resulting a reduced dataset as described in Table S1. A total of 81,570,102 markers and 2408 individuals were used at the beginning of the analysis.
Historical census size for European populations was obtained from McEvedy [11].
For each population of the 1000 Genome we ran IBDSeq Ibdseq r1206 [12] using the default parameters.
Then IBDNe ibdne.23Apr20.ae9 [8] was applied to IBDseq output using the default options but testing various mincm values; for the final result mincm = 2 was chosen.
To convert generations in years we consider a single generation to correspond to 30 years. The relationship between census size (Nc) and effective population size (Ne) was calculated according to Pankratov [3].
We defined the start of a possible bottleneck as the peak in the Ne curve and the end of such bottleneck as the valley following the peak. The peaks and valleys were determined using the functions findPeaks and findValleys implemented in the R package quantmod [13].
We used two measures in order to assess the impact of any possible bottleneck or decline. The first one is the Ratio between the Ne at the peak and the Ne at the valley. The second one is defined as the Intensity of the bottleneck (If), which was calculated as the fraction of change in Ne per generation. Peaks and valleys could correspond to consecutive generations with the same Ne, in that case, we consider the most recent generation as a peak and the later generation as a valley.
An additional evaluation of the population bottlenecks on the 1000G population was done using ASCEND methodology [14]. For the decay curve parameters, we used a minimum genetic distance in Morgans of 0.001 and a maximum genetic distance of 0.3 Morgans, with a bin size of 0.001 Morgans. We used a random outgroup population of 20 individuals to correct the within-population allele sharing correlation in order to remove the background. We considered only the runs with a NMRSD (normalized root-mean-square deviation) < 0.29 as suggested in Tournebize et al.
We assessed the power to detect a change in Ne using both IBDNe and ASCEND simulating 100 diploid individuals from the following three populations scenarios with msprime [15]: (A) Growing population facing a sudden drop of 90%; (B) Stable population facing a sudden drop of 90%; (C) Stable population facing a sudden drop of 99%.
We first explored the 1000 Genomes dataset by searching for signatures of extensive population size reductions, also known as bottlenecks by using the software ASCEND [14], this approach is designed to infer the timing and the strength of founder events and is also suitable for datasets and populations with few samples or low coverage.
We found, in most cases, only founder events that date back to thousands of years ago, well beyond the available written historical record about population sizes (Figure S1, Table S2). Failing to retrieve any significant bottleneck within the historical time for any of the 1000 Genomes populations is not surprising, since ASCEND is designed to infer bottleneck durations between 1 to 30 generations and a founder size ranging from 5 to 1000 with a starting population of 12500, as described by the authors of the methods. In other words, the least severe bottleneck that ASCEND is expected to detect is quite extreme, especially when considering historical times, allowing only the 1% of the original population to survive, which is quite unlikely in recent historical times. We then resorted to IBDNe, given the availability of around 100 samples for each population and its ability to provide an Ne trajectory for the last 2000 years at a single-generation resolution. By this way we could go beyond a strict definition of bottlenecks and focus on any change in Ne, which could still be informative of the underlying historical events such as smooth decline and growth or pulse-like events.
We hence generated several Ne curves for each population of our dataset (Figure 1) and found remarkable heterogeneity within each continental group, attesting the high specificity of the method. This was expected, given that the demographic histories of different populations depend on widely different local circumstances. Importantly, we chose not to report confidence intervals of the Ne estimates in Figure 1 to maximize the readability of the several curves we grouped together as single continental panels. Confidence intervals are available from Table S3 and, while important to properly assess the Ne at a given time point, we believe their absence in Figure 1 would not hinder the focus of our exploration: an overall interpretation of Ne trends over time, with no particular emphasis on comparisons between pairs of populations. Most African populations show a peak within the last 50 generations followed by a decrease, and only two of them (YRI, ACB) were able to recover such loss. As for Asia, Southern Asian populations show on average lower Ne values than Eastern ones, but only CHB and JPT are characterized by a steady Ne increase in recent times. In America, non-native populations sampled in the United States display a population drop after the year 1500, consistent with the founder events associated with the migration or forced relocation of these groups. Finally, most European populations to a certain extent exhibit a relatively recent decrease (<25 generations) in Ne, followed by a steady increase up to the present (with the exception of CEU).

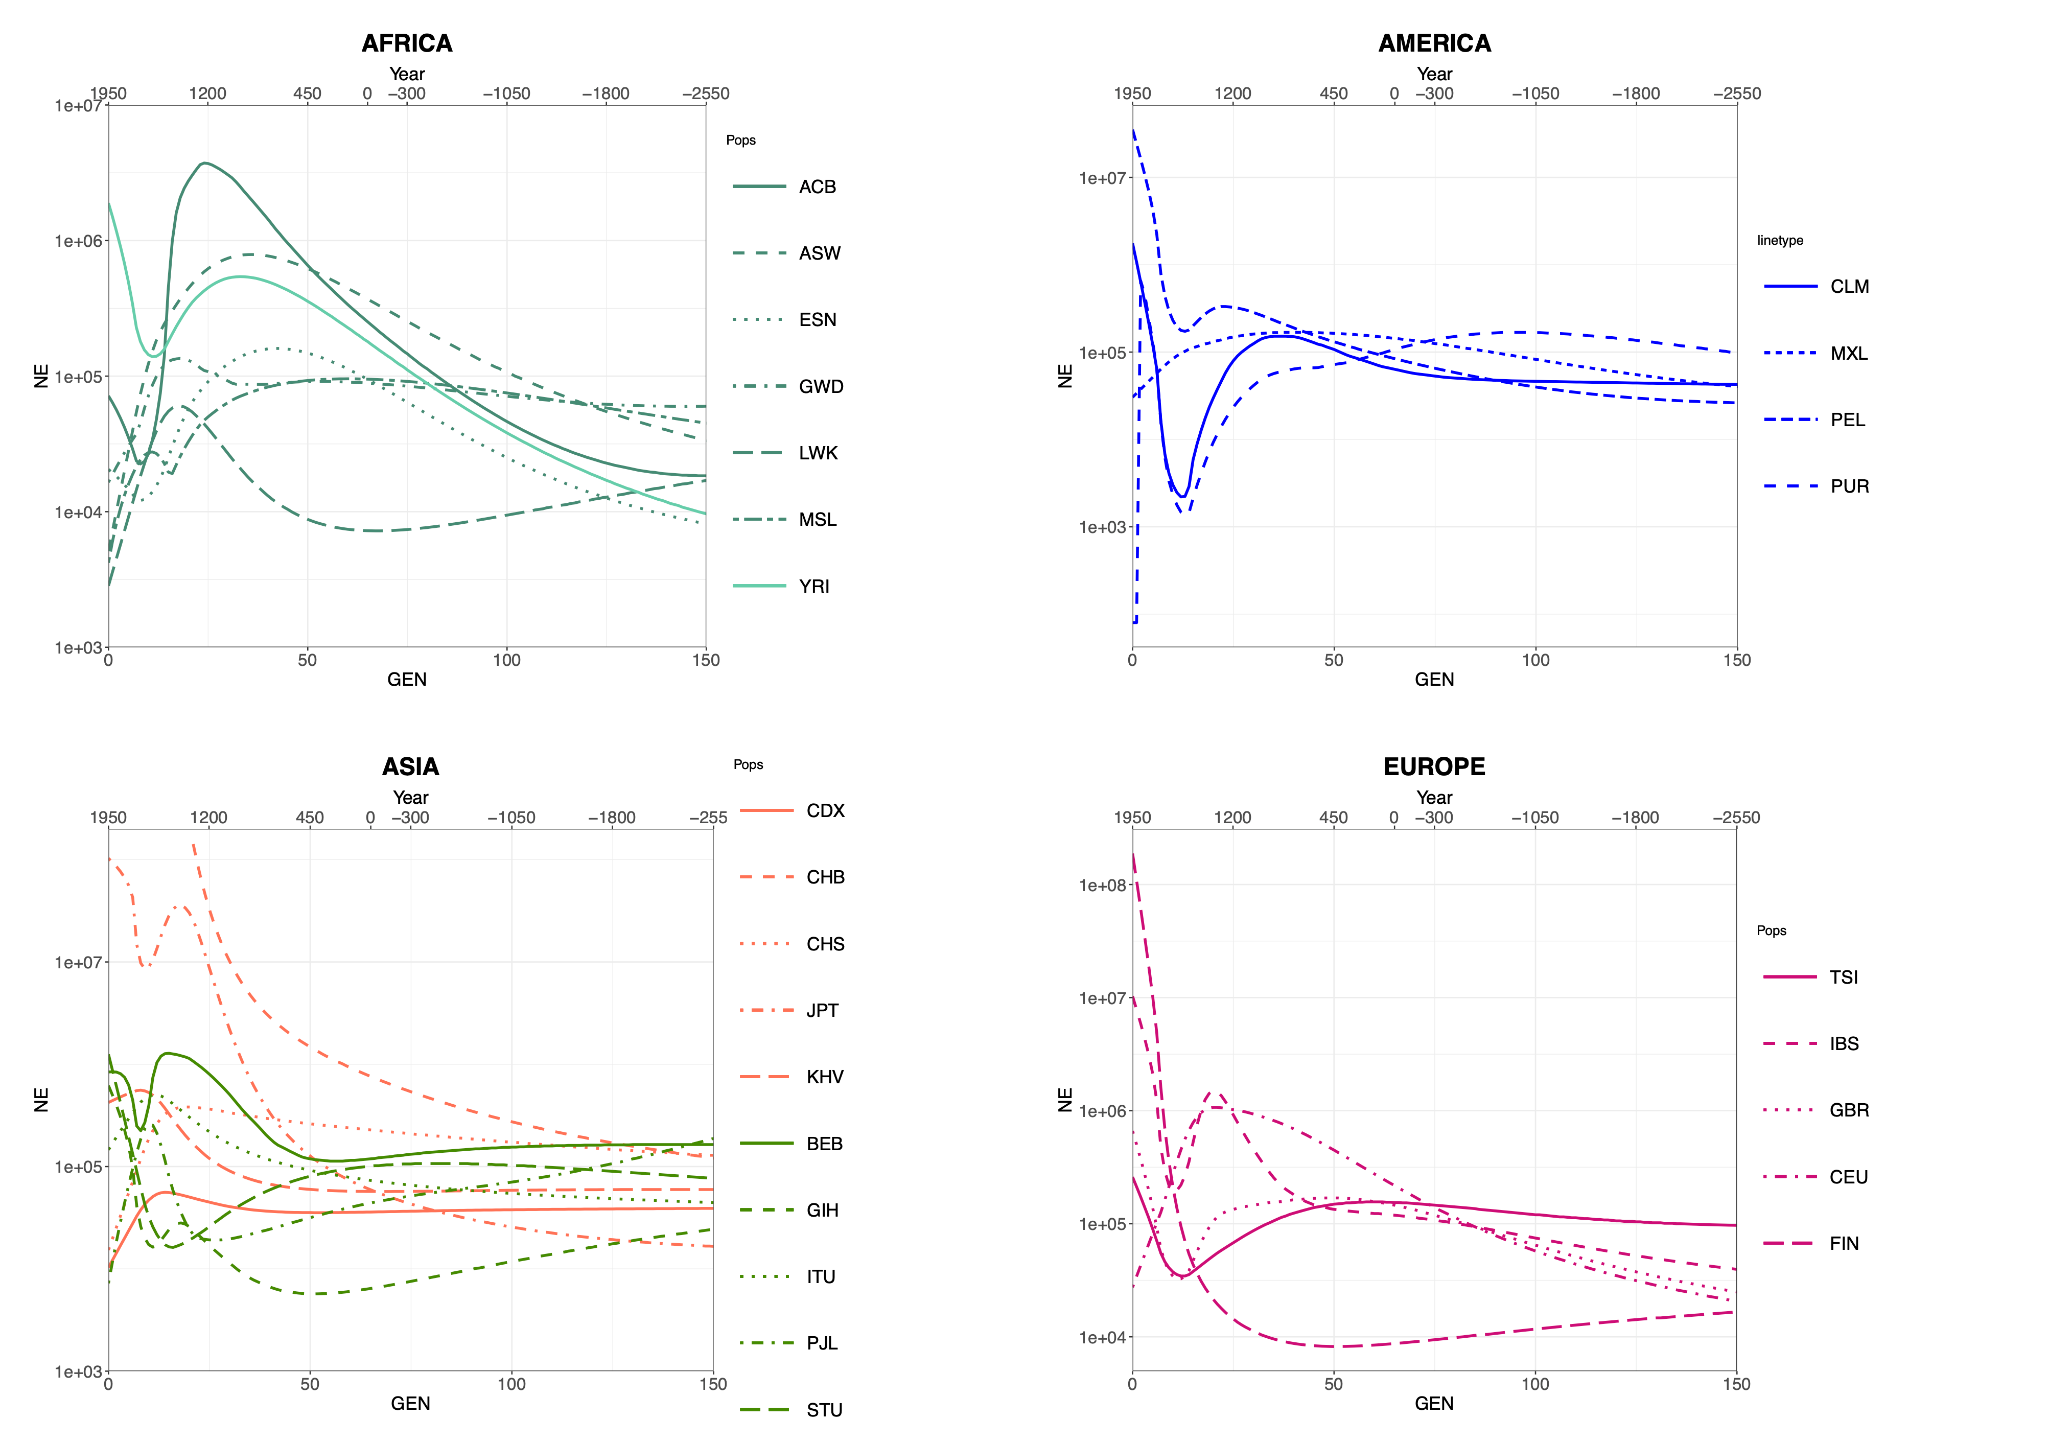
Figure 1 Ne median values over time for the 26 populations of 1 KG grouped and color-coded by continent, plotted against time (generations ago and calendar years). The two x axes measures are linked by the formula year = 1950 − (30*gen). For confidence intervals of the Ne curves displayed here, please refer to Table S3.
We then compared the Ne values inferred by IBDNe and census (Nc) estimates from McEvedy [11]; for more recent periods and where available we also used HMD 2023 [16] for the populations for which reliable historical record was available (Figure 2, Table S3). For each curve, we used quantmod [13] to estimate peaks, the beginning of a population drop, and valleys, the end of the drop and beginning of the population growth, (highlighted as red and blue cells respectively in Figure 2) and reported the percentage in Ne change between the most recent peak and valley in Table S4. At a global level, the population drop ranges between 37% (GIH) and 99% (CLM) when estimated via Ne. Conversely, the intensity of the bottleneck estimated as the % of change per generation is higher in the IBS (I = 8%), with respect to CLM (I = 4%).
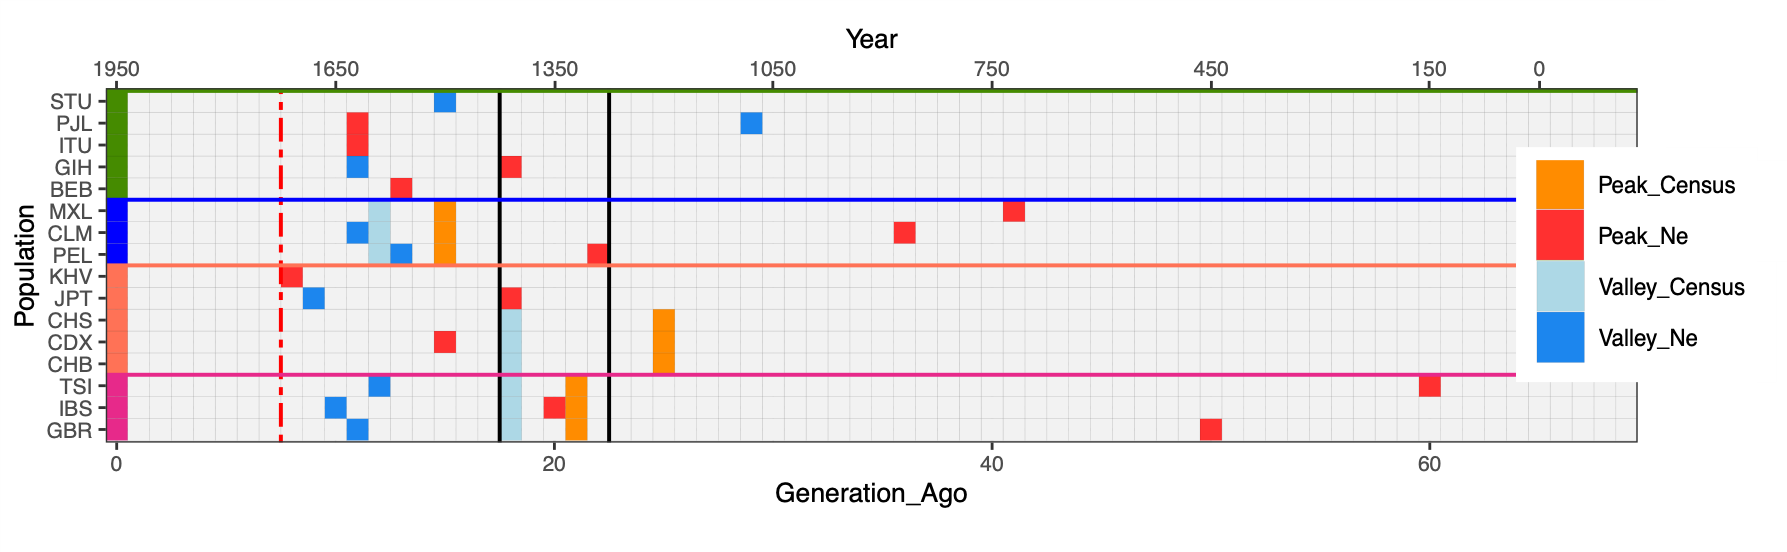
Figure 2 The peaks represent the starting of a bottleneck/decline and the valleys represent the start of recovery of expansion. The black lines represent the first century of Plague outbreaks in Europe (1320–1440). At least one population from Europe, East Asia, South Asia and America exhibits a peak during the Black Death Period. Dashed red line points to the beginning of the industrial revolution in the UK.
We note that all European populations start growing at around 1600, well before the industrial revolution, and at least three of them (IBS, GBR and CEU) show a decrease in growth at around 1300, while the others begin their Ne decline a little before. Such a pattern has been already reported for the French population [17] and is intriguing given the well-known prevalence of epidemic, famine and warfare in Europe at that time, with Black Death (the epidemic caused by Yersinia pestis, see Supplementary Historical note) being the most prominent. Furthermore, the recovery of European populations from the 17th century is also supported by recent research on population dynamics (see Text S1).
We also showed via simulation that our ability to detect the timing of peaks and valleys along an IBDNe curve is supported when using as little as 100 individuals [Figure S2(A),(B)]. While a thorough assessment of the IBDNe method is beyond the scope of this article, we stress that the detection of the start of a population recovery (e.g., a valley) is consistently detected from our simulations. Furthermore, while 100 individuals per population constitutes perhaps the lower boundary for the usage of IBDNe, we are confident that the Ne trajectories shown for the analysed population are not an artefact of the method, as each population display an almost unique curve and, when similar patterns are observed, their magnitude along the Ne axis in unique for each population.
To further delve into this troubled period for the history of the European populations, we leveraged on Ne and Nc estimates to assess the population change across the whole 1300–1600 transect and provide such an estimate in the Table 1. For the census size we investigated the historical estimates between 1320 and 1410, as they represent the points before the advent of the epidemic and before the recovery of the census size of the populations in Europe, thus giving insights into the impact of the Black Death on the census size of different countries. On the other hand, for the effective population size (Ne), we investigated a window starting from ~1300 CE and the following 11 generations (~330 years) as the effect of a bottleneck on genetic variation are not completely synchronous with the demographic such as the effect of the recovery. Our analysis of European populations showed the greatest drop in IBS (85%) from a Ne viewpoint, and a generalized drop in the order of 30% all across Europe from Nc estimates.
Table 1 Ne estimates at 1290 and 1620 for the five analyzed European populations and the % of change and comparison with Nc estimated between 1320 and 1410.

While Nc and Ne may point to different aspects of the same event (namely the number of deaths vs. the consequences of these onto the genetic diversity of the surviving offspring), it is nevertheless intriguing to explore the relationship between the two. In a recent paper Pankratov and colleagues [3] showed a remarkable connection between Ne and Nc estimation in Estonia, where a simple population genetics formula could be used to derive Nc from Ne obtained from contemporary data. In a nutshell, a point Ne estimate can be converted into its Nc counterpart by multiplying it by a constant (4.89), allowing for a two-fold error in both directions. This 4.89 conversion factor stems from empirical considerations on demographic parameters to be expected for a human population. Particularly, the formula assumes for an average human population its Fis (inbreeding coefficient) to be numerically equivalent to 0, its relative fraction of reproducing males comprised within a range of 0.1 and 0.9 and the variance of reproductive success (DV) to be in a range between −1 and 3. While strong deviations from these assumptions are of course possible, these were deemed to be unplausible for the majority of present-day human populations. We applied the Pankratov et al. formula to the Ne curves inferred here for the 1000 Genomes project and compared the historical Nc with the ones expected by the Nc proxied by the Ne conversion (Figure 3). We noted various levels of concordance between the Ne and Nc curves, which we estimated through a linear correlation (Pearson’s R). The correlation between Ne and Nc varied from a maximum of 0.76 for CHB~China to a minimum of −0.62 for TSI~Italy (GBR~British Isles Nc, r = −0.47 p = 0.056; TSI~Italy Nc, r = −0.62 p = 0.009; IBS~Spain Nc, r = 0.63 p = 0.006; GIH~Indian Subcontinent Nc, r = 0.71 p = 0.002; JPT~Japan Nc, r = 0.65 p = 0.006; CHB~China Nc, r = 0.76 p = 0.0006). These striking differences in similarity between the two estimators can be caused by several confounders. The most notable of all is represented by the inevitable fact that for certain populations (Tuscans, Chinese and South Asians), the genetic information is available at a regional level, while Nc is usually reported at a national one. It follows that the two patterns may be radically different for simple sampling reasons. Other confounders may include recent admixture events that violate assumptions of panmixia, as well as peculiar histories of culturally-mediated inbreeding or in general non-random mating that may not be properly accounted for in the general scenarios contemplated by the Pankratov et al. 2020 formula.

Figure 3 Ne over time scaled to match Nc with a two-fold error ribbon (lines in shades of blue) plotted with census data for given countries/areas by McEvedy (red line with dots corresponding to data available for that year).
With our work we provided Ne trajectories for all the populations of the 1000 Genomes Project, which can prove a useful reference for future genetic and historical investigation.
When focusing on populations for which historical records about Nc are solid and available in a processable format, we note that Ne and Nc show a match when both genetic and historical data refer to the same national-level population. Genetic information from smaller (i.e., regional) populations yielded Ne and an inferred Nc that are predictably smaller than the national-level Nc available from historical sources. For the same reason, samples from different European countries are not readily comparable when they reflect regional (for example the Tuscan from Italy, TSI), Nation-wide (Iberian Populations in Spain, IBS) or a subset of the national diversity (British From England and Scotland, GBR) which, after removing PCA outliers are likely to display more localized patterns than the ones identified with broader sample sets such as the UK10K dataset. Similar differences between regional and national patterns had already been reported for the Estonian genomes [3], where more than 200 genomes were available for the smallest of the tested groups. With these promising observations in mind, and considering that the reported Ne curves are based on genetic lineages that survived until present day, we pose the question: to what extent the observed changes in Nc reverberated in the Ne profile of these populations and, conversely, how much the events that characterized the analyzed historical period carved a trace within the genomic landscape of the surveyed populations?
From our results, it appears clear that the whole of Europe experienced a shared decline of Ne starting ~1300 and stopping at around the year 1600, as also reported for the French population in a previous work [17]. This is compatible with a period of known wars, famine and epidemics, the most impactful of which being the Black Death pandemic, followed by overall social disarray, stopping only after the year 1500 [18,19]. The Black Death reached Europe through the port of Messina (Sicily), where, in 1347, some galleys had landed with dozens of infected Genovese sailors on board [20]. These had fled from Kaffa (Crimea) after the siege of the city by the Tartars. Within six years of the Black Death's arrival in Sicily, dozens of chroniclers of the time [21–26] speak of unprecedented mortality attesting that many believed the end of the world had come. Recurring waves of plague were recorded on average every 10 years and ended in Europe with the great plague of Marseilles in 1720. Minor outbreaks actually were subsequently recorded in southern Italy, whereas in the Ottoman Empire plague was recorded until the late 19th century [27–29]. These outbreak waves are commonly referred to as the "Second Plague Pandemic", with the first one appearing in Europe during the reign of Justinian (542 A.D.) and the third one departing from China in the late 19th century and spreading to all continents, except Europe [30,31]. Unfortunately, it is not possible to calculate accurate European mortality during the Black Death using the accounts of chroniclers of the time, as they lack reliable statistical analysis, while archaeological proxies may offer a more sound alternative [32].
An interesting possibility to survey the Ne trajectories in the past would be to calculate ROH in ancient DNA datasets, however the small sample size for many of them and the lack of high-coverage genome are still hampering this approach.
As a matter of fact, over the past hundred years there has been a heated debate among historians on the ways the plague was transmitted and on its demographic impact on medieval societies.
If there is now consensus on the fact that the first outbreak hit almost one third of the European population [33], it is most difficult to determine the impact of the following outbreaks because they varied from zone to zone often for unclear reasons [34]. Most importantly, all sources clearly show that the cyclical recurrence of the disease prevented population growth until the seventeenth century [35,36]. It follows that while point estimates of the effects of a given outburst of the disease may be specific for a given town/region, as also pointed out by data on the crop yield [37] in Europe showing punctuated trends of land use/abandonment, the expected overall consequence on European demography may indeed be a generalized stagnation of population over many centuries (see Text S1).
We here show that this period indeed left an evident genetic signature and can be explained by an overall drop in population size (inferred from genetics) between 39% (in Tuscan, TSI) and 85.5% (in Spanish, IBS). Such dramatic changes in population sizes spanned however just a few generations, escaping the classical definition of bottlenecks (ASCEND), yet marking crucial events in the genetic landscape of the analyzed populations.
However, it is important to stress that on the one hand our results provide an estimate that is measured only on the genomes of survivors, on the other we provide a perspective across multiple European sampling points to better appreciate the variegated impact of Black Death depending on the region of Europe one examines.
Furthermore, the interpretation of Ne as a proxy for Nc is only possible keeping in mind important caveats such as (i) the inferred Ne refers to the ancestors of present people and not necessarily to all people that lived at the scrutinized time, and that these ancestors did not necessarily inhabited the geographic area currently associated with the sampled population (the most obvious case being American populations); (ii) inference based on genetics may smooth consecutive sudden growth and drops; (iii) IBDNe error increases considerably in the last few generations.
In addition, gene flow, admixture and consanguineous marriages could impact negatively in this linear relationship between Ne and Nc, nevertheless, we could assume that a close correlation between the Nc inferred from Ne and Nc inferred from the historical source could give us an indication of relative simple demography with few confounders, a lack of correlation could imply hidden genetic confounders actors, such as substructure, inbreeding admixture, or on the other hand exaggeration of lack on reliable information from historical sources.
In conclusion, through statistical analysis (IBDNe) performed on modern European genomes, we were able to infer high resolution Ne trajectories that highlighted numerous population changes that occurred in Europe over the past two thousand years, and in particular during the 14th century, coinciding with the so-called "Black Death” epidemic, which, combined with wars and famines well known to have occurred during this critical period may have impacted the observed Ne trajectories. In agreement with recent historical publications, we observed a population decline of more than 50% in many of the populations analyzed followed by a demographic recovery that occurred before the beginning of the industrial revolution.
The following supplementary materials can be downloaded at: HPGG2303030006SupplementaryMaterials.zip.
Text S1. Historical note about Black Death in Europe.
Figure S1. ASCEND analysis.
Figure S2. Coalescent simulations.
Table S1. Populations sample used in the analysis.
Table S2. Results of ASCEND for all the populations included in the present study.
Table S3. Full data on Ne and Nc for the analyzed populations.
Table S4. Estimation of bottleneck size and intensity estimated between the most recent Ne peaks and valleys.
Not applicable.
Not applicable.
The datasets generated and/or analyzed in the study are available in the 1000 Genomes Project repository: https://www.internationalgenome.org/.
Luca Pagani is a member of the Editorial Board of the journal Human Population Genetics and Genomics. The author was not involved in the journal’s review of or decisions related to this manuscript. The authors have declared that no other competing interests exist.
Conceptualization: CT, AB, LP, MM; Formal Analysis: MM, FDP, LV; Resources: IB, LP, CT; Writing original draft: MM, FDP, LP, CT, IB, AB, LV.
| 1. | Pagani L, Lawson D, Jagoda E, Mörseburg A, Eriksson A, Mitt M, et al. Genomic analyses inform on migration events during the peopling of Eurasia. Nature. 2016;538(7624):238-242. [Google Scholar] [CrossRef] |
| 2. | Prüfer K, Racimo F, Patterson N, Jay F, Sankararaman S, Sawyer S, et al. The complete genome sequence of a Neanderthal from the Altai Mountains. Nature. 2014;505(7481):43-49. [Google Scholar] [CrossRef] |
| 3. | Pankratov V, Montinaro F, Kushniarevich A, Hudjashov G, Jay F, Saag L, et al. Differences in local population history at the finest level: the case of the Estonian population. Eur J Hum Genet. 2020;28(11):1580-1591. [Google Scholar] [CrossRef] |
| 4. | Browning SR, Browning BL, Daviglus ML, Durazo-Arvizu RA, Schneiderman N, Kaplan RC, et al. Ancestry-specific recent effective population size in the Americas. PLoS Genet. 2018;14(5):e1007385. [Google Scholar] [CrossRef] |
| 5. | Ongaro L, Scliar MO, Flores R, Raveane A, Marnetto D, Sarno S, et al. The Genomic Impact of European Colonization of the Americas. Curr Biol. 2019;29(23):3974-3986.e4. [Google Scholar] [CrossRef] |
| 6. | Li H, Durbin R. Inference of human population history from individual whole-genome sequences. Nature. 2011;475(7357):493-496. [Google Scholar] [CrossRef] |
| 7. | Schiffels S, Durbin R. Inferring human population size and separation history from multiple genome sequences. Nat Genet. 2014;46(8):919-925. [Google Scholar] [CrossRef] |
| 8. | Browning SR, Browning BL. Accurate Non-parametric Estimation of Recent Effective Population Size from Segments of Identity by Descent. Am J Hum Genet. 2015;97(3):404-418. [Google Scholar] [CrossRef] |
| 9. | The 1000 Genomes Project Consortium. A global reference for human genetic variation. Nature. 2015;526(7571):68-74. [Google Scholar] [CrossRef] |
| 10. | Chang CC, Chow CC, Tellier LCAM, Vattikuti S, Purcell SM, Lee JJ. Second-generation PLINK: Rising to the challenge of larger and richer datasets. GigaScience. 2015;4(1):s13742-015-0047-8. [Google Scholar] [CrossRef] |
| 11. | McEvedy C, Jones R. Atlas of world population history. Great Britain: Penguin Books Ltd. and Allen Lane; 1979. [Google Scholar] |
| 12. | Browning BL, Browning SR. Detecting identity by descent and estimating genotype error rates in sequence data. Am J Hum Genet [Internet]. 2013;93(5):840-851. [Google Scholar] [CrossRef] |
| 13. | Ulrich JM. quantmod: Quantitative Financial Modelling Framework.. R package version 0.4.24. [cited 2023 May 10] Available from: https://cran.r-project.org/web/packages/quantmod . |
| 14. | Tournebize R, Chu G, Moorjani P. Reconstructing the history of founder events using genome-wide patterns of allele sharing across individuals. PLoS Genet. 2022;18(6):e1010243. [Google Scholar] [CrossRef] |
| 15. | Kelleher J, Etheridge AM, McVean G. Efficient Coalescent Simulation and Genealogical Analysis for Large Sample Sizes. PLoS Comput Biol. 2016;12(5):e1004842. [Google Scholar] [CrossRef] |
| 16. | Max Planck Insistute for Demographic Research, University of California, French Insitute for Demographic Studies. Human Mortality Database [Internet]. [cited 2023 May 10] Available from: https://www.mortality.org/ . |
| 17. | Saint Pierre A, Giemza J, Alves I, Karakachoff M, Gaudin M, Amouyel P, et al. The genetic history of France. Eur J Hum Genet. 2020;28(7):853-865. [Google Scholar] [CrossRef] |
| 18. | Biraben JN. Les hommes et la peste en France et dans les pays européens et méditerranéens. Population. 1975;6(30):1143-1144. In French. [Google Scholar] |
| 19. | Alfani G. Pandemics and Asymmetric Shocks: Evidence from the History of Plague in Europe and the Mediterranean. J Hist Environ Soc. 2020;5:197-209. [Google Scholar] [CrossRef] |
| 20. | De Mussi G. Istoria de Morbo sive Mortalitate quae fuit Anno Dni MCCCXLVIII, Piacenza 1348. |
| 21. | Boccaccio G. Decameron. Milano: BUR-Rizzoli; 2013. In Italian. [Google Scholar] |
| 22. | Petrarca F. Familiarum Rerum Libri. Firenze; 1993. [Google Scholar] |
| 23. | Da Piazza (attributed) Michele. Historia Sicula. In Bibliotheca scriptorum qui res in Sicilia gestas sub Aragonum imperio retulere. Palermo. p.1791-1792. [Google Scholar] |
| 24. | Di Tura Del Grasso (attributed) Agnolo. Rerum Italicarum Scriptores. Bologna: Zanichelli; 1933. [Google Scholar] |
| 25. | Villani G. Nuova Cronica. 2007th ed.. Parma: Guanda; 1348. [Google Scholar] |
| 26. | De Gauliaco G. Chirurgia Magna. Florence; 1585. [Google Scholar] |
| 27. | Ayalon Y. Natural Disasters in the Ottoman Empire: Plague, Famine, and Other Misfortunes. Cambridge: Cambridge University Press; 2014. [Google Scholar] |
| 28. | Dols WM. The Black Death in the Middle East. Princeton: Priceton University Press; 2019. [Google Scholar] |
| 29. | Varlick N. Plague and Empire in Early Modern Mediterranean World: The Ottoman Experience, 1347-1600. Cambridge: Cambridge University Press; 2015. [Google Scholar] |
| 30. | Benedict C. Bubonic Plague in Nineteenth-Century China. Stanford: Stanford University Press; 1996. [Google Scholar] |
| 31. | Little L. Plague and the End of Antiquity: The Pandemic of 541–750. Cambridge: Cambridge University Press; 2006. [Google Scholar] |
| 32. | Barbiera I, Castiglioni M, Zuanna GD. A synthetic measure of mortality using skeletal data from ancient cemeteries: The d index. Demogr Res. 2018;38:2053-2072. [Google Scholar] [CrossRef] |
| 33. | Livi Bacci M. A concise History of World Population. Malden and Oxford: John Wiley; 2017. [Google Scholar] |
| 34. | Del Panta L. Le epidemie nella Storia Demografia italiana. Bologna: Clueb; 2021. [Google Scholar] |
| 35. | Barbiera I, Castiglioni M, Zuanna GD. Standard Life Tables for Western and Southern Europe from Antiquity to the Black Death. Pop e Stor. 2021;22(2):73-97. [Google Scholar] [CrossRef] |
| 36. | Livi Bacci M. In The Mortality Crisis in Transitional Economies. Oxford: Oxford University Press; 2000. p.38-58. [Google Scholar] |
| 37. | Izdebski A, Guzowski P, Poniat R, Masci L, Palli J, Vignola C, et al. Palaeoecological data indicates land-use changes across Europe linked to spatial heterogeneity in mortality during the Black Death pandemic. Nat Ecol Evol. 2022;6(3):297-306. [Google Scholar] [CrossRef] |

![]()
Copyright © 2024 Pivot Science Publications Corp. - unless otherwise stated | Terms and Conditions | Privacy Policy


