
Human Population Genetics and Genomics ISSN 2770-5005
Human Population Genetics and Genomics 2024;4(1):0001 | https://doi.org/10.47248/hpgg2404010001
Original Research Open Access
GRUPS-rs, a high-performance ancient DNA genetic relatedness estimation software relying on pedigree simulations
Maël Lefeuvre
1

 ,
Michael David Martin
2
,
Flora Jay
3
,
Marie-Claude Marsolier
1,4
,
Céline Bon
1
,
Michael David Martin
2
,
Flora Jay
3
,
Marie-Claude Marsolier
1,4
,
Céline Bon
1
Correspondence: Maël Lefeuvre; Céline Bon
Academic Editor(s): Maanasa Raghavan
Received: Sep 28, 2023 | Accepted: Dec 18, 2023 | Published: Jan 4, 2024
This article belongs to the Special Issue Paleogenomics, ancient DNA, and genomic tales of human history
© 2024 by the author(s). This is an Open Access article distributed under the terms of the Creative Commons License Attribution 4.0 International (CC BY 4.0), which permits unrestricted use, distribution, and reproduction in any medium or format, provided the original work is correctly credited.
Cite this article: Lefeuvre M, Martin M, Jay F, Marsolier M, Bon C. GRUPS-rs, a high-performance ancient DNA genetic relatedness estimation software relying on pedigree simulations. Hum Popul Genet Genom 2024; 4(1):0001. https://doi.org/10.47248/hpgg2404010001
Background: The study of fine-grain genetic kinship ties (parents, siblings, cousins, etc.) from ancient remains is nowgaining significant interest within the field of paleogenetics, as a means of deciphering the social organization of past societies. However, kinship analyses are in practice often quite difficult to apply within paleogenetic studies, and may carry a high degree of uncertainty in the results they provide, especially when applied on low coverage and/or highly degraded samples, or when studying poorly characterized populations. To overcome these challenges, most of the available kinship estimation methods either refrain from inferring ties beyond the second degree (e.g., half-siblings), and/or rely on the use of a cohort of individuals to obtain a satisfactory statistical significance. Thus, the current state of the art remains intrinsically limited when attempting to estimate kinship on a small number of individuals, or when trying to detect more distant relationships (e.g., cousins).
Methods: Here, we present GRUPS-rs: an update and complete reimplementation of GRUPS (Get Relatedness Using Pedigree Simulations), an ancient DNA kinship estimation software based on the methods originally developed in (Martin et al. 2017). GRUPS-rs both computes an estimate of relatedness from randomly sampled pseudo-haploidized variant calls, and leverages high-definition pedigree simulations to bypass the use of a cohort of individuals.
Results: We highlight that GRUPS and GRUPS-rs are especially suitable to perform kinship analysis on a restricted number of ancient samples, and can provide a sufficient statistical significance to estimate genetic relatedness past the second degree, while taking into account user-defined contamination and sequencing error estimates. Importantly, GRUPS-rs offers an estimated 14000-fold speed-up in runtime performance compared to its predecessor — allowing the joint estimation of kinship between dozens of individuals in a matter of minutes — and is now bundled with a user-friendly Shiny interface, in which users can interactively visualize their results.
Conclusions: The GRUPS kinship estimation method is now fully operational in its “GRUPS-rs” implementation, whose use is particularly recommended when analyzing a restricted number of low coverage DNA samples.
Keywordskinship estimation, genetic relatedness, ancient DNA, paleogenomics, pedigree simulations
Attempts to unravel close genetic ties using ancient DNA have often proved an invaluable tool to capture vivid snapshots of the social customs, burial practices and rules of residence from past societies [1, 2]. As such, the study of genetic kinship within archaeological contexts, and the joint development of dedicated methods to estimate genetic relatedness from ancient DNA have been the subject of increasing interest [3]. In addition, the ability to accurately infer close genetic ties from ancient DNA samples can be used to quickly identify, match and differentiate disparate bone remains, but also has evident applications in the field of forensics [4, 5, 6]. Such inference remains in any case a compulsory quality control step in population studies, as the presence of genetically related samples may lead to biased estimates of genetic associations and/or diversity.
While the detection of genetic relatedness is often considered a trivial analysis when applied to modern samples, classical methods typically require diploid genotypes, along with precise estimates of the population allele frequencies, to compute the probability of two alleles being identical by descent P(IBD). In practice, this information is seldom retrievable from archeological contexts, due to the significant degradation of the available genetic material, and the lack of a well characterized reference population. Dedicated methods, specifically adapted to decayed and/or low-coverage DNA must therefore be applied. In particular, many ancient DNA kinship estimation methods currently address the challenge of inferring kinship from low coverage samples either (i) by computing P(IBD) from genotype likelihoods, to account for the inherent uncertainty of the available genotype calls [7, 8], or (ii) by estimating the average pairwise mismatch rate (PMR), usually from randomly sampled pseudohaploid genotypes, and subsequently normalizing these results across all available pairwise comparisons [9, 10, 11, 12].
Despite promising advances in recent years [12, 13, 14], the current state-of-the-art regarding the assessment of genetic relatedness from ancient DNA still faces multiple challenges, which most of the currently available methods fail to fully address. On the one hand, maximum likelihood methods such as IcMLkin [7] and NgsRelate-v2 [8] are able to provide precise estimates of kinship well beyond the second degree. However, these methods may quickly lose their statistical power to infer relatedness when applied against poorly covered samples (e.g., 0.01X-0.5X) [15]. On the other hand, methods based in whole or in part on normalized PMR estimates between two individuals, such as READ [11], KIN [12], or the eponymously named “Kennett method” [10], while generally able to work with extremely low coverage data [15], are explicitly required to be applied on a collection of individuals. This constraint may prove difficult to address in the case of archaeological contexts comprised of merely a handful of human samples [16, 17, 18, 19, 20].
Finally, most ancient DNA kinship estimation methods fail to explicitly account for the presence of modern contamination, sequencing errors, and/or the presence of recent inbreeding amongst studied individuals (KIN and NgsRelatev2 being notable exceptions). Thus, accurately estimating more distant genetic ties between low-coverage samples, while accounting for the inherent biases of ancient DNA, often remains in practice — despite the promising recent proposals of the KIN [12] and correctKIN [14] methods — an arduous prospect, as evidenced by the fact that several methods explicitly refrain from venturing beyond the second degree of relatedness [11, 13].
GRUPS (Get Relatedness Using Pedigree Simulations) [9] was precisely developed to address some of the previously mentioned challenges of ancient DNA kinship estimation:
Like several other ancient DNA kinship estimation methods, GRUPS is based on the direct estimation of pairwise mismatch rates between individuals, allowing its application on low coverage samples.
However, a specific strength of GRUPS lies in the fact that it does not require to be applied on a collection of ancient individuals to normalize its results, but rather leverages pedigree simulations from a reference panel of present-day human phased genotypes.
Through these simulations, GRUPS is also able to account for modern human contamination and sequencing errors, as well as to perform ad-hoc tests of recent inbreeding.
However, GRUPS remained a computationally demanding method, both in terms of runtime and memory requirements, making its application reserved to massively parallel computing cluster environments. Here, we present GRUPS-rs, a major update and pure Rust [21] implementation of GRUPS, which both addresses this drawback by providing with a 14000:1 increase in runtime performance, and improves upon several methodological aspects of the initial algorithm.
The algorithm applied in GRUPS and GRUPS-rs when investigating kinship on a given pair of individuals i, j can be subdivided into four main steps:
Calculate the observed average pairwise mismatch rate (
Using the exact same overlapping positions used in (1), and within a user-defined template family-tree, perform pedigree simulations in hundreds of replicates, using randomly sampled individuals from a modern genotype reference panel, as founder individuals (Figure 1B).
From these pedigree simulations, compute the expected theoretical distributions of pairwise mismatch rates for a set of K user-defined relationships within the template family tree (e.g., Parent-Offspring, Halfsiblings, Cousins, Unrelated, etc.) (
Assign the most likely relationship for each pair of samples i, j, given

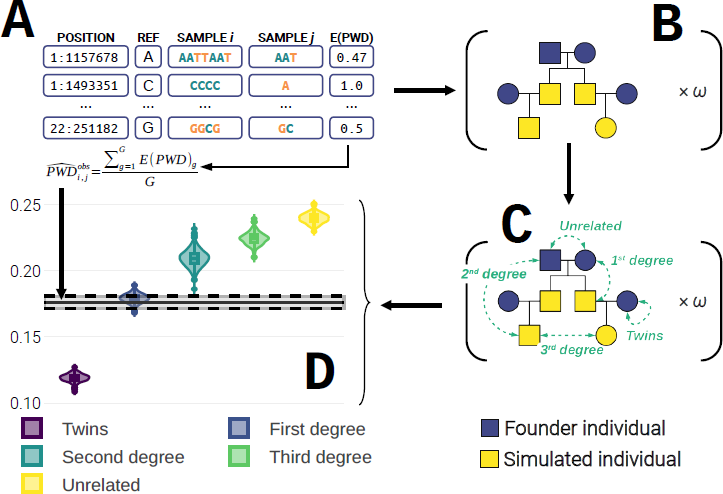
Figure 1 Illustration of the main steps performed in GRUPS-rs. A: Direct estimation of the observed pairwise mismatch rate (
The first step of GRUPS involves estimating the average genetic distance between the observed sequences of two ancient individuals (
where G is the set of all the overlapping positions of individuals i and j, qi,g and qj,g respectively represent the proportion of non-reference alleles of individuals i and j, at position g.
In the special case of self-comparisons, however, we adjust this measure to ensure comparison is performed against distinct nucleotides, to avoid biases potentially arising from comparing a nucleotide to itself. (Note that this correction naturally implies that performing self-comparison is restricted to sites where the number of observations γi,g ≥ 2). In other words, the long-term average PMR when performing self-comparison becomes the probability of sampling two mismatching alleles at a given position, without replacement (Equation 2):
where qi,g represents the proportion of non-reference alleles at position g for individual i, and γi,g represents the number of observations at position g for individual i.
In GRUPS, the process of simulating pedigrees was performed sequentially, across both pedigree replicates, and chromosomes. This general strategy carried a toll on the size and memory complexity of the algorithm, as it implied that (i) each input file was read through ω times, (ii) whole chromosome genotypes had to be loaded in memory to simulate founder individuals, and (iii), whole chromosome crossover simulations had to be performed within descendants. Thus, to both minimize the required number of memory allocations, and to alleviate the strain imposed by I/O operations, our strategy in GRUPS-rs instead relies on initializing ω pedigree replicates from the start, and simulating founder alleles and descendants on a per-genotype basis. Recombination events within the genome of descendants are thus constructed dynamically by keeping track of the contributing chromosome strand of each ancestor.
Initialization of pedigrees
For each pair of individuals, pedigree simulations are performed in hundreds of replicates, by targeting the exact same overlapping positions for that given pair. This step requires the following inputs and parameters:
a user-defined template family tree, along with a set of kinship ties to investigate (provided in the form of a simple configuration file).
a reference dataset, containing phased genotypes of modern individuals (e.g., the 1000g-phase3 dataset [22]).
a fine-scale genetic map (e.g., Phase II HapMap [23]).
a target source population, or super-population label (e.g., ASW, AFR, CEU, etc.) for all pedigree founder individuals.
a target source population, or super-population label for all contaminating individuals.
library-specific estimates of the rate of modern human contamination and sequencing errors. (These parameters can be provided as ranged estimates.)
library-specific assignments for the number of contaminating individuals.
a number of desired pedigree simulation replicates ω.
For each considered pairwise comparison, ω pedigrees are first initialized by randomly assigning individuals from the source population as founders within the template family tree. Likewise, each pedigree is given a randomly assigned set of contaminating individuals of size (ci, cj), where ci and cj are the user-defined numbers of contaminating individuals for library i and j, respectively. (Among others, methods such as AuthentiCT [24], ContamLD [25], or DICE [26], may provide with genome-wide estimates of modern human contamination.) Likewise, each pedigree is assigned with the corresponding set of library-specific contamination rates (ξi, ξj) and sequencing error rates (>i, >j). (Here again, the software DICE [26] may equally provide with genomewide estimates of the sequencing error rate for every library.) In the case where these user-defined values were specified as ranges, pedigree-specific values for these parameters are randomly sampled from a uniform distribution within the provided range.
Note that the initialized number of contaminating individuals, rate of contamination, and sequencing error rates are tied to the libraries being compared, and not to the individuals composing the family tree.
Simulating descendants within each pedigree
For each pedigree replicate, GRUPS first retrieves the genotype of each founder individual from the input reference dataset. The genotype of each descendant is then iteratively constructed by simulating recombination events in each ancestor. Following [27], we model events of crossing-over through a simple Poisson process and simulate effective recombination events within each ancestor as the probability that an odd number of crossing-over events ever occurs between the current coordinate g and the previously observed coordinate g – 1 (Equation 3).
where θ represents the known genetic distance (in cM) found within the range [g – 1; g[. (This value is parsed from the user-provided genetic recombination map.)
Simulating contamination and sequencing error rates
When comparing two individuals within a given pedigree, GRUPS-rs emulates the process of pseudo-haploid random sampling by simply selecting one out of the two alleles of each individual at random. A pairwise mismatch rate is then reported by comparing the two selected alleles.
Following in the footsteps of its predecessor, GRUPS-rs additionally provides with a simple probabilistic model of contamination by allowing, right before evaluating pairwise differences, the random replacement of the previously selected allele for each individual, using the user-defined contamination rate ξi for a given library i. Once a specific allele is selected for replacement, GRUPS-rs dynamically retrieves the genotypes of each contaminating individual and replaces the initial observation by randomly sampling a single observation within this collection. Thus, the overall probability of replacing the initially sampled observation by an alternative allele through contamination can be defined as (Equation 4).
where ξi is the user-defined estimate of contamination assigned to library i, rc is the number of alleles from contaminating individual c that are identical to the allele initially sampled in the pedigree individual, and Ci is the user-defined number of contaminating individual(s) to simulate for library i.
Likewise, GRUPS and GRUPS-rs provide a rudimentary model to simulate sequencing error rates, by randomly replacing the previously sampled allele with an “erroneous” allele, sampled from one of the three remaining possibilities with a uniform probability of 1/3. Hence, the rate at which a previously sampled allele is replaced by an erroneous one merely equals the user-defined library specific sequencing error rate >i. In cases where such estimates were not provided by the user, we instead approximate this rate by using the average of the Phred quality scores found at the given nucleotide position g of the library i. While this latter approximation can be expected to represent a source of bias in high-coverage samples, we here rely on the assumption that the input data of GRUPS is of relatively low-coverage and the fact that we are effectively mimicking a random pseudo-haploid sampling process during pedigree simulations.
As the manner in which the contamination and sequencing error simulation model of GRUPS-rs were implemented mirrors that of its predecessor, we expect that their respective impact on the resulting distribution of theoretical
Increasing rates of contamination are expected to flatten all distributions of
Increasing rates of sequencing error are expected to shift all
Obtaining a distribution of simulated
Within each pedigree replicate, and once all genotypes have been simulated, GRUPS-rs performs random sampling of alleles, and updates a record of any occurring pairwise difference for each considered kinship tie within the template family tree. This process, once averaged over all positions, allows GRUPS-rs to obtain a set of expected
Assigning the most likely relationship between a given pair i, j, given the previously obtained
Briefly, for any given pair of samples, we first transform the pedigree simulations results from a K - class ordinal classification problem to a set of K - 1 binary classification problems (Figure 2). We then fit a linear SVM classifier for every binary problem, in which the classifier’s objective is to deduce whether the given pair’s relationship is greater than k, given
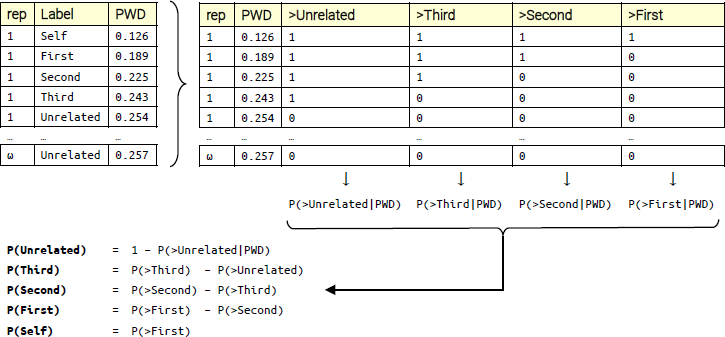
Figure 2 Illustrative example of the relationship assignment procedure of GRUPS-rs on a single pair of individuals, with K = 5 investigated relationships, and ω pedigree simulation replicates. Raw pedigree simulation results are first converted from a K - class ordinal problem to a set of K – 1 binary problems, which are then used to fit K — 1 binary SVM classifiers.
Finally, the one vs. all probability of belonging to relationship k can be extracted using the following general scheme:
It should be noted that this classification procedure could be easily reduced by fitting a simple decision tree, since our classification problem is one-dimensional in nature. However, the use of SVMs offers the advantage of being easily scalable to multiple input features, and easily tunable to minimize false positives [31].
The previous version of GRUPS [9] relies on querying random genotypes from sequence variation datasets such as the 1000g-phase3 dataset. These data types are most often found in the form of VCF and/or BCF files [32]. While this file format remains an undisputed gold standard in most applications, the repeated act of decompressing and querying these files can however take a toll on general performance. Indeed, the expected time complexity of retrieving alleles for an individual within a tabix-indexed compressed VCF file can approximate O(l · log(b)) (where b is the number of BGZF blocks found within the bgzip-compressed VCF, and l is the number of individuals in the dataset [33]), especially when considering that most of the retrieved coordinates are expected to be found in nonadjacent blocks, given the low sequencing coverages typically retrieved from ancient DNA samples.
Here, we devise a simple scheme within GRUPS-rs to re-encode the input dataset as a set of deterministic acyclic finite state acceptors (FSA) [34]. This strategy has repeatedly proven its effectiveness for indexing biological sequences and databases [35, 36, 37]. Briefly, our procedure involves reading through the entire input dataset once, and constructing a set of two binary encoded FSAs for each chromosome, where:
The first FSA indexes the genotype of each reference individual found within the database. Each key is encoded in the form
<CHR><POSITION><SAMPLE-ID><ALLELE>
The second FSA indexes population allele frequencies at each position. Each key is encoded in the form
<CHR><POSITION><POP-ID><ALLELE-FREQUENCY>
Using such a scheme, we effectively reduce the complexity of fetching a random genotype from O(l · log(b)) to O(κ), where κ is the length of the key used to construct the FSA, while preserving an acceptable compression rate (Figure 3). To minimize the memory footprint, construction of this FSA index is performed through an incremental procedure described in [38], and is pre-implemented in Rust, through the “fst” library [39].
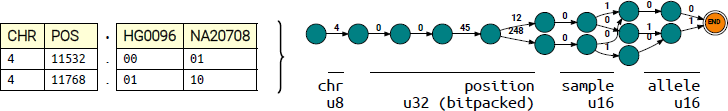
Figure 3 Illustrative example of the encoding of a VCF file containing two samples and two coordinates, and the process of conversion to an FSA-encoded data structure. Each edge of the resulting FSA corresponds to a single character from the constructed key. To alleviate disk usage, information about chromosome, position, sample and allele is re-encoded into unsigned integers. u8, u16, and u32 respectively represent a 1-, 2- or 4-byte unsigned integer.
This procedure is an optional, multithreadable, one-time operation within GRUPS-rs, which can furthermore be used to (i) filter out multiallelic and/or non discrete genetic variations from the dataset, (ii) filter out unnecessary populations, and (iii) recompute population allele frequencies. The use of FSA-encoded genotypes also carries the added benefit of greatly alleviating the memory consumption of GRUPS-rs during runtime, as FSA are characterized by their ability to be directly queried without decompression. This characteristic further implies that our data can be queried through the use of memory-mapped files, instead of loading them into memory.
To benchmark GRUPS-rs with a controlled input dataset, we first simulated the genotypes of eleven related individuals within a predefined pedigree with the software ped-sim v1.3 [40], using individuals from the EUR population of the 1000g-phase3 dataset as founder individuals. We then generated raw, ancient DNA sequence data for those eleven simulated individuals using Gargammel v1.1.2 [41] with the following parameters: an average coverage of 1X, a set fragment length of 70bp, and ignoring contamination (-c 1 -l 70 –comp 1,0,0).
Raw sequences were then aligned on the GRCh37 reference genome using bwa aln v0.7.17 [42] (-l 1024 -o2 -k2 -n0.01), and subsequently quality-filtered using samtools view v1.15 [43] (-q20 -e ’length(seq)>30’ -F4). Duplicate reads were then removed using Picard Mark Duplicates v2.27.4 with default parameters [44]. Finally, we generated a single pileup file with samtools mpileup v1.15.0 (-RB -q20 -Q20), while targeting autosomal positions from the Allen Ancient DNA Resource (AADR) “1240K” SNP dataset, version 52.2 [45].
The resulting pileup file contained the sequence aligment of our 11 simulated individuals, at 1,150,354 genomic coordinates, and with an average local sequencing depth of 2.13X. To test the average runtime of GRUPS-rs at different coverages, we generated nine subsets by recursively splitting odd and even numbered lines of our input pileup file into two separate files, until acquiring a set of 512 pileup files of 2246 lines each. This procedure thus allowed us to generate a total of 1023 distinct input pileup files, set at ten different values of average pairwise SNP overlap (ranging from 686,530 to 1340).
We further expanded the parameter space of our runtime benchmark by applying GRUPS-rs on each condition of average pileup size, while varying the number of studied individuals from 2 to 11, for a total of 100 different conditions.
For each condition, we applied GRUPS-rs using the following set parameters:
500 simulation replicates;
input dataset: 1000g-phase3 dataset (FSA-encoded);
5 investigated kinship ties, within a template family tree of 8 individuals (4 founders, 4 simulated descendants);
A filtration excluding variants with minor allele frequency < 5%.
This benchmark was replicated 10 times to obtain estimates of the average runtime and maximum resident set size of GRUPS-rs for each condition. The benchmarking was performed on a single desktop computer equipped with an Intel® Xeon® Gold 5218R-2.10GHz CPU, and an SSD Micron 1300 SATA with an approximate read/write transfer rate of 525 MB/s.
All scripts and input data used to perform this benchmark are available on Github (See Availability of Data and Material).
In order to evaluate its classification performance, we also applied GRUPS-rs on our entire simulated dataset of 1023 pileup files and evaluated its ability to estimate kinship at different values of average pairwise SNP overlap — using the same parameters as our runtime benchmark. As our template pedigree contained a total of 55 comparisons and five distinct degrees of relationship (1 Twin, 12 First-degree, 8 Second-degree, 3 Third degree, 31 Unrelated), a total of 56265 predictions were assessed during this benchmark. From these predictions, we assessed the per-class estimates of sensitivity, specificity and accuracy for these five distinct degrees of relatedness (Self, First, Second, Third, and Unrelated), using the “caret” R package, version 6.0-94 [46]. Likewise, we obtained general accuracy estimates of GRUPS-rs at these ten different values of pairwise overlapping SNPs.
To assess its ability to detect fine-grain levels of kinship beyond the second degree, we applied GRUPS-rs on a set of 36 Early-Neolithic samples from the Hazleton-North (Gloucestershire, UK) Cotswold-Severn long cairn. This archaeological site was initially described in [47] ; its construction and occupation were estimated to fall within the range 3695-3620 BC [48].
These samples were later reevaluated using paleogenomic analyses in [1], and are now known to form an intricate family tree encompassing five generations, and involving kinship ties up to the 8th degree (Figure 4). This dataset also carries the benefit of containing individual sequencing depths spanning three orders of magnitude ([0.018X–9.75X] ; median: 2.9X), allowing us to investigate a wide range in the number of pairwise SNP overlaps and to assess our method’s ability to work at lower coverages.
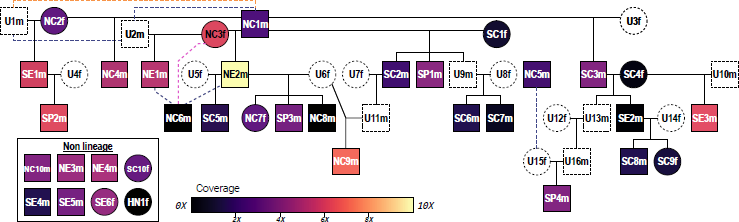
Figure 4 Curated pedigree reconstruction of the Hazleton North samples (adapted from [1]). Squares and circles respectively correspond to male and female individuals. White dashed shapes correspond to unsampled, inferred individuals. The fill color of every box is in proportion to the individual’s coverage on the autosomal positions of the AADR “1240K” SNP dataset. Purple, blue and orange dashed lines represent indirect observations of probable second, third, and fourth-degree relationships, respectively.
We therefore chose to investigate kinship ties up to the fifth degree of relatedness on this dataset using GRUPS-rs, in an attempt to compare our results to both the curated pedigree and the main method applied in the original publication — also known as the “Kennett” method [10]. Briefly, this method belongs to a class of approaches commonly used in paleogenomics, as it relies on computing normalized PMR estimates from a collection of samples, using random pseudo-haploidized genotype calls. Thus, the method is highly similar to the widely used READ method [11], both in terms of methodology and general performance [15].
All results, scripts and jupyter notebooks generated during this analysis are available online on Github (See Availability of Data and Material).
Binary alignment files from the Hazleton-North cairn samples were first downloaded from the European Nucleotide Archive (accession number: PRJEB46958). All alignment files were then summarized within a single pileup file using samtools mpileup v1.15.1, with GRCh37 as a reference genome, and targeting autosomal positions from the Allen Ancient DNA Resource (AADR) “1240K” dataset, version 52.2 [45] (-RB -q25 -Q25).
We then applied GRUPS-rs on all samples using the following parameters:
1000 pedigree replicates;
using a template family tree of 9 individuals (4 founders, 5 descendants), and investigating 7 different kinship ties (Self, First degree, Second degree, Third degree, Fourth degree, Fifth degree, Unrelated);
setting the simulated contamination and sequencing error rate to 0;
using individuals from the 1000g-phase3 EUR super-population as a source population for the founders (FSA-encoded).
Following an approach similar to [1], we annotated degrees of relatedness while considering all SVM probabilities that were greater or equal to 5%. For example, a pair whose PSVM (pair = 2nddegree) and PSVM (pair = 3rddegree) probabilities were above 5% would be annotated as “Second or Third degree”). Furthermore, we annotated any pair of individuals whose PSVM (pair = Unrelated) was found greater than 5% as “Unrelated” (Table S1).
From there on, we define any of these “lenient” predictions as a discrepant result whenever its range does not contain the degree of relatedness identified within the family tree reconstructed in [1]. For example, a prediction such as “Third degree or more” would be considered discrepant if the actual kinship tie is “Second degree”, but would be considered consistent if the actual relationship is “Fourth degree”. Here, we consider the reconstructed pedigree of [1] as a benchmark value in view of the fact that it has been cross-verified through multiple methods and data sources, including — but not limited to — mitochondrial/Y-chromosome haplogroup information, X-chromosome sharing patterns, and the use of NgsRelate-v2 [8]. Furthermore, the dense and intricate nature of this family tree also made it possible to discard most of the possible topologies, through a process of triangulation.
An estimate of the relatedness coefficient r was obtained for each pair i, j through a simple normalization step, in which we divide
Finally, we compared our annotated results with those originally obtained through the Kennett method, which are available in the Table S4 and Table S5 of [1].
To compare and evaluate their respective classification performances, we first generated confusion matrices for both methods, and obtained estimates of the by-class sensitivity and specificity, using the “caret” R package, version 6.0-94 [46]. A general estimation of the similarity of each method’s classification performance was obtained by applying a Newcombe-Wilson two-sample test for equality on the proportion of true positives found within the matrix [49, 50].
Correlation between the estimates of relatedness coefficient r for each method was estimated by applying a Mantel test [51] on two kinship matrices, containing the Euclidian distances between said r-coefficients, using the R-package “vegan”, version 2.6-4 [52] (“Pearson” correlation method, with 5000 permutations). Gross differences between the mean distribution of r-coefficients were tested using two- and one-sided Wilcoxon’s signed-rank test [53].
To exemplify the proficiency of GRUPS in examining intricate genealogies, we applied GRUPS-rs on a subset of the Koszyce dataset from [54]. Here, 7 individuals from a mass grave attributed to the Globular Amphora culture — hereupon named K1, K2, K5, K10, K11, K14, and K15 — were previously identified as part of a puzzling family tree. More precisely, while individuals K5, K10, K11, and K15 displayed patent signs of being siblings — as they all shared an apparent first-degree relationship, as well as the same mitochondrial and Y-chromosome haplogroup — individuals K11 and K10 merely shared a second-degree relationship with K14, the presumed mother of K5 and K15. Thus, the authors of [54] concluded that (i) K10/K11 were half-siblings of K5/K15 and (ii) the unsampled mother of K11 and K10 (hereafter named U0.2f) might have been biologically related to K14. However, while these initial findings were later confirmed in at least two independant studies [13, 15] the exact degree of relationship separating these individuals remains elusive to this day.
To elucidate the cryptic relationship between K14 and U0.2F, we applied GRUPS-rs using a set of four template pedigrees, each describing a different hypothesis regarding their degree of relatedness (Figure S1). These four scenarios respectively encapsulate the hypotheses that K14 and U0.2f either share (i) no genetic relatedness (“outbred” scenario), (ii) a first-degree relationship (“siblings” scenario), (iii) a second-degree relationship (“half-siblings” scenario), and (iv) a third-degree relationship (“cousins” scenario). Here, our intent is to delineate the most likely relatedness between K14 and U0.2f, given the output SVM probabilities of GRUPS-rs for each scenario, by leveraging the fact that the correct genetic link of K14 and U0.2f is expected to be reflected throughout their descents, and generate intermediate relatedness coefficients between these individuals (Table S2). Specifically, 6 out of the 21 assessed pairwise relationships, K[5,15]-K[10-11] and K2-K[5,15], are of particular interest, as these relationships are both expected to shift according to that of K14-U0.2f, and showcase intermediate relatedness coefficients (e.g., the pair K5-K11 is expected to be classified as three-quarter siblings (2nd + 3rd degree) only if K14-U0.2f share a first-degree relationship).
Binary alignment files for the seven Koszyce individuals K[1,2,5,10,11,14,15] were downloaded from the European Nucleotide Archive (Accession number: PRJEB28451). As these samples had not been subjected to UDG-treatment, we first verified the prevalence of post-mortem damage within this dataset using map Damage version 2.2.1 [55]. Considering the non-negligible estimated rates of nucleotide misincorporation [54], we chose to apply soft clipping on each alignment file using the trimBam module of the software bam Util, version 1.0.15 [56]. To ensure thoroughness, we carried out an adaptive scheme, wherein the trimming length along each end of the fragment was determined using the previously obtained damage estimates of map Damage, and enforced until the misincorporation frequency reached 0.01. The resulting trimmed alignment files were then condensed into a single pileup file using samtools mpileup v1.15.1, the GRCh37 reference genome, and the autosomal positions from the AADR “1240K” dataset, version 52.2 [45] to target specific positions (-RB -q25 -Q25).
We then ran a separate analysis of GRUPS-rs on the final pileup file for every template pedigree, using the following set parameters:
1000 pedigree replicates;
setting the sequencing error rate to 0;
using individuals from the 1000g-phase3 EUR super-population both as a source population for the founders, and as a source of contamination (FSA-encoded);
while providing the contamination rate estimates found in [54] as input parameters during simulations.
Finally, we elected a most likely scenario by comparing the overall congruence between the predictions of GRUPS-rs, and the theoretical expectations under these four scenarios. To further interrogate these results, we calculated for each scenario the average maximum SVM probability across all predictions, and used this metric as a global estimate of confidence.
GRUPS-rs offers several improvements and additional features compared to GRUPS, including:
A substantial increase in runtime performance of the main algorithm (See section 3.2).
The ability to process and examine multiple pairwise comparisons in a single run.
The ability to leverage reference datasets other than the 1000g-phase3 project variant callset as an input reference. (Any dataset containing phased diploid genotypes may be used as a reference.)
A “user-friendly” command line interface.
Significant improvements within the main algorithm (as described in sections 2.1.3 and 2.2).
Finally, the main software is bundled with the grups.plots R library: a Shiny dashboard graphical user interface designed to facilitate the visualization, interaction and analysis of the results generated by GRUPS-rs.
Our main software, GRUPS-rs, and its companion library grups.plots, are available on Github (See Availability of Data and Material).
Our benchmark reveals that the average runtime of GRUPS-rs scales linearly with both the number of comparisons and the average number of pairwise overlapping covered SNP positions (Figure 5A; Table S3), reaching an average runtime of around 214 minutes when computing 55 comparisons with a pileup targeting around 1.15M SNPs. This behaviour towards a linear scaling also emerges when looking at the maximum recorded resident set size during execution (Figure 5B), which reached a maximum of 4.9GiB at these upper boundary conditions.
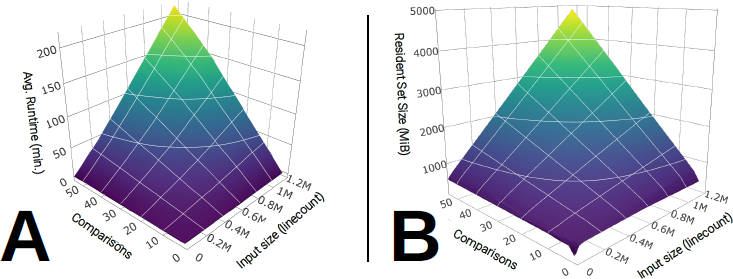
Figure 5 Runtime and memory benchmark results of GRUPS-rs against the number of pairwise sample comparisons (range: [1-55]) and the average number of overlapping SNPs (range: [2246-1, 150, 354]) (n = 10 benchmark replicates per condition). A: 3D-surface plot of the average recorded runtime (in minutes) against the number of comparisons and SNP overlap. B: 3D-surface plot of the maximum recorded resident set size (in MiB) against the number of comparisons and SNP overlap. Note that peak resident set size values may suffer from inaccuracies at lower program runtime. Shades of colors displayed on each surface plot are redundant with the values of the z-axis. Raw values are available in Table S3.
Remarkably, our benchmark of GRUPS-rs provided us with an average runtime of merely 235 seconds when comparing a single pair of individuals at the maximum overlap of 1.15M SNPs, and using 500 replicates (Figure 5). This result corresponds to a gross 14000:1 improvement in runtime, when compared to the previous implementation of GRUPS, which in contrast takes an average of 6800 seconds to compute a single pedigree replicate with the same parameters. Evidently, this improvement of performance is mainly due to the fact that GRUPS-rs is now written in a compiled language, but also due in part to our implementation of FSA-encoded reference datasets, and improvement on the pedigree simulations algorithm, which minimizes memory allocations and I/O throughput.
These results must, however, be considered in light of the fact that our benchmark does not take into account the average local sequencing depth of the input individuals, which may in practice differ from our set value of 2.13X, either when working with higher-coverage samples and/or SNP capture data. Applying GRUPS-rs across multiple threads however remains a perfectly parallelizable task that can be trivially implemented by the user, should he/she wish to further decrease the overall runtime when analyzing a batch of samples. In general, this benchmark enables us to confirm that the time and size complexity of GRUPS-rs amounts to at least O(α · G), where α is the number of comparisons and G, the average SNP overlap for each pair. Applying a simple linear regression model on our raw benchmark results also provides a crude estimation of the expected runtime and memory consumption, which highlights that the number of comparisons α is by far the most impactful factor:
Our benchmark of GRUPS-rs using our simulated dataset showed that this method can maintain a global accuracy well above 92%, down to an average pairwise overlap of 2700 SNPs. Additionally, we note that the accuracy still remains above 85% when applied to merely 1300 SNPs, while still taking into account third-degree relationships (Figure S2). Here, predictions involving first- and second-degree relationships remain above the 95% accuracy threshold until around 1300 and 2700 SNPs respectively. As expected, third-degree classifications displayed the poorest performance out of all estimated classes, reaching accuracies below 95% once the number of overlapping SNPs was below a threshold found in between 11000 and 5400. Though quite rudimentary in nature, and portraying close to ideal conditions in the context of ancient DNA, our benchmark still confirms that GRUPS-rs is a method that is well applicable to very low coverage datasets, and retains an accuracy that is at least equal, if not greater than its predecessor, GRUPS.
GRUPS-rs generally produced kinship estimates that are highly congruent with the results showcased in the initial publication, with only 43 discrepant predictions out of a total of 595 comparisons (7.22%) (Figure 6A), against 38 out of 595 (6.4%) for the Kennett method (Figure 6B). As expected, most of these discrepancies involve kinship ties lying beyond the fourth degree of relationship, with respectively 90.6% and 92.1% of these discrepant results involving 5th degree ties or beyond, for GRUPS-rs and the Kennett method. It should be noted, however, that this slight increase in the amount of misclassification can in part be explained by an overconfidence in the estimates provided by GRUPS-rs, as evidenced by the existence of three 3rd to 4th degree, and four 4th to 5th degree misclassifications, suggesting a potential bias towards overestimating kinship when investigating more distant ties. Hence, while it’s worth noting that GRUPS-rs was the sole method able to confidently assign three pairs of individuals as 4th degree, it nevertheless displays a limited positive predictive value when examining such distantly related pairs, despite our implementation of an internal SVM classifier and, counter-intuitively, regardless of the overlap rate (Figure S3). As per other methods, caution should therefore be exercised when assessing ties beyond the third degree with GRUPS-rs. The use and cross-analysis of several kinship estimation methods thus remain the most appropriate approach whenever feasible, as previously stated in [15].
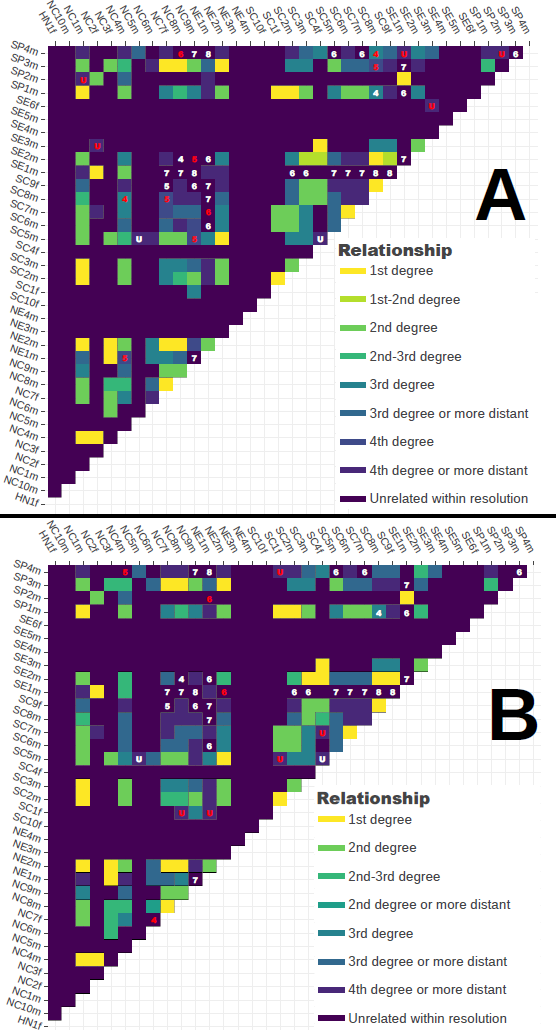
Figure 6 Application of GRUPS-rs on the Hazleton North dataset, and comparison with the results showcased within the original publication [1]. A, B: Kinship matrices of all Hazleton North samples obtained with either GRUPS-rs (A) or the Kennett method (B). Each cell of the matrix corresponds to a pairwise comparison. Colors represent the estimated relationship for the given pair. Discrepancies between the relationship estimate and the reconstructed pedigree (Figure 4) are highlighted as colored numbers, where the numeric value corresponds to the exact degree of relatedness (U: “Unrelated”). Red and white colors respectively correspond to method-specific, or shared discrepancies between the two methods.
On the contrary, GRUPS-rs displayed a lesser degree of confidence compared to the Kennett method when investigating 1st degree relationship, as evidenced by the presence of three 1st or 2nd degree classification, all of which involved individual SE2m, whose coverage amounts to approximately 0.035X (Figure 4 and Figure 6). These three comparisons were on the other hand confidently assigned as 1st degree by the Kennett method. Investigating the classification performance metrics of both methods in more detail nonetheless revealed a general accuracy of 0.80[0.77 – 0.94] for GRUPS-rs, and 0.79[0.75 – 0.82] for the Kennett method. Per-class precision, recall, and F1-scores of both methods equally display a high consistency, with slightly higher F1-scores in favor of GRUPS-rs when investigating 2nd–, 3rd–, 4th - degree and Unrelated pairs (Figure S4). In any case, Newcombe-Wilson’s two-sample test for equality on the proportion of true-positives found within each confusion matrices failed to suggest any significant difference, neither when applied to the lenient confusion matrices found in Figure 6 (χ2 = 0.212, p – value = 0.6452), nor to the “hard” confusion matrices found in Figure S4 (χ2: 0.749, p – value = 0.3867).
Likewise, applying a Mantel test between both methods’ r-coefficient dissimilarity matrices revealed that GRUPS-rs and the Kennett method display a highly consistent estimation of the r-coefficient (r – statistic : 0.9966, significance: 1.99 · 10 –4). Applying a two-sided Wilcoxon signed ranked test however reveals a significant difference in the mean r-coefficient distribution of each method (p – value < 2.2e – 16), with a tendency for higher r-coefficient estimates stemming from GRUPS-rs (mean bias error: 0.022) (Figure S5).
Taken together, these results suggest an approximately equal consistency between GRUPS-rs and the Kennett method. This should further be regarded in light of the fact that GRUPS-rs does not require the use of a cohort of individuals to normalize its results, and remains relevant even when applied to a single pair of individuals, as opposed to Kennett’s and several other currently available methods [11, 12]. Moreover, GRUPS-rs is largely capable of detecting kinship ties beyond the second degree, unlike several alternative methods leveraging random pseudo-haploid genotype calls [11, 13].
Our reassessment of the Koszyce dataset using GRUPS-rs, once applied with a template pedigree assuming a first-degree relationship between K14 and U0.2F, provided excellent congruence with theoretical expectations (Figure 7). Of particular note, our method fittingly classified pairs (i) K[5, 15]-K[10, 11] as three-quarter siblings (r=0.375), (ii) K2-K[5, 15], as three-quarter avuncular (r=0.1825), and (iii) K2-K14 as half-avuncular (r=0.125; Figure 7C, Figure S6). Furthermore, we emphasize that the “siblings” template pedigree is the only scenario — out of the four tested — that did not display any discrepant relationships (Table S4). These results confirm the hypothesis that K14 and U0.2F were genetically related, and strongly suggest that they were in fact tied to the first degree. While GRUPS-rs is unable to distinguish between ties with a same degree of relatedness, these findings do enable us to narrow down the relationship of K14-U0.2f to merely three possible solutions, where U0.2f was either the mother, sibling or daughter of K14.
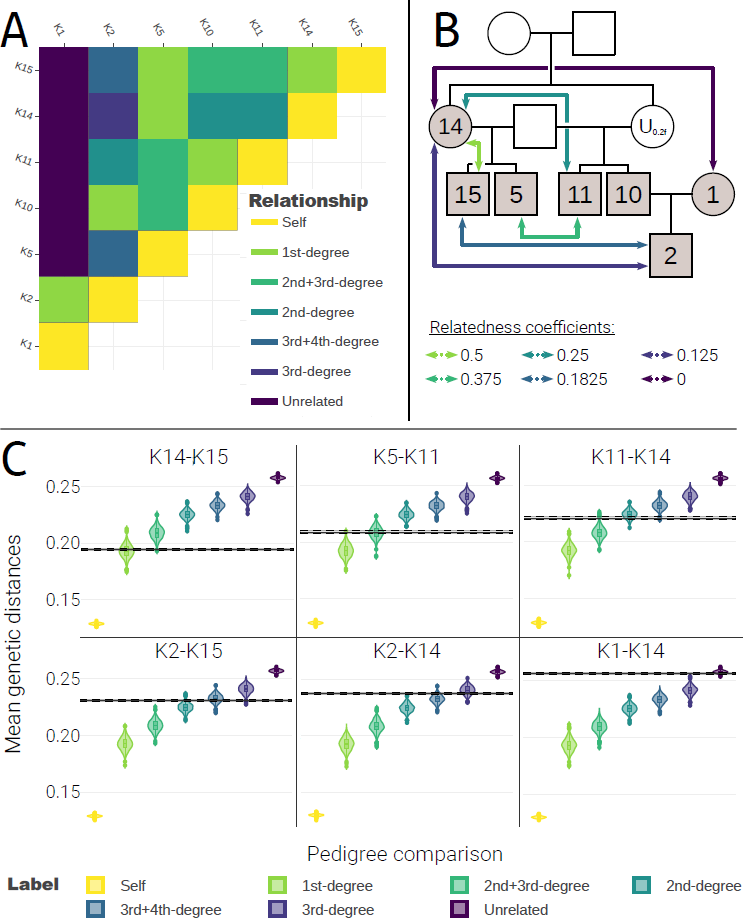
Figure 7 GRUPS-rs kinship analysis results of the Koszyce dataset, under the hypothesis that K14 and U0.2f share a first-degree relationship. A: Kinship matrix of all Koszyce individuals. Relationship labels such as “2nd+3rd-degree” indicate intermediate relationships (e.g., “2nd+3rd-degree” indicates that the pair shares both a second-degree and a third-degree relationship). B: Theoretical expectations, under the hypothesis that K14 and U0.2f share a first-degree relationship. Grey and white colored boxes represent sampled and unsampled individuals, respectively. Colored arrows indicate the expected relatedness coefficient for a given pair of individuals. C: Selected sample of GRUPs-rs’ simulation results (results for the complete dataset can be found in Figure S6). Colored violin plots represent the distributions of
Finally, we emphasize, through this final example, that GRUPS-rs’ ability to leverage user-defined template family trees makes this method a powerful and flexible instrument to test and/or confront complex scenarios of kinship ties or unions involving inbreeding (e.g., double first-cousins, three-quarter siblings, sesqui-cousins, levirate unions, etc.). To our knowledge, this feature is unique amongst all currently available ancient DNA kinship estimation softwares.
It must be pointed out that the benchmark and case-study results presented here make extensive use of the EUR population and the 1240K SNP panel, a dataset which is still widely used during paleogenomic analyses to this day, but is now known to be a potential source of ascertainment bias, particularly when applied against ancient non-Eurasian populations [57, 58, 59]. Hence, we caution that the raw accuracy values showcased in section 3.3 are expected to vary according to the source population at hand, and the targeted panel of SNPs, as previously noted in [9]. In practice, we advise that users either pay thoughtful consideration when selecting a publicly available target SNP panel or, whenever possible, make use of a custom panel, specifically tailored for their sample libraries when using GRUPS-rs. The - - maf parameter may moreover prove useful to exclude fixed allele positions within the reference population during pedigree simulations.
While GRUPS and GRUPS-rs do not explicitly rely on the use of input population allele frequencies, these methods still require phased reference genomes to estimate kinship. Although the field of paleogenomics has achieved significant methodological advancements in the imputation and phasing of ancient genomes in recent years [60, 61], the current quantity of readily phaseable ancient genomes remains restricted, and the practicalities of applying GRUPS-rs using ancient genomic data remains to be evaluated. Thus, while the use of ancient reference datasets may become a feasible prospect in a near future, applying GRUPS-rs in the immediate term will most likely require using modern reference genomes such as the 1000-genomes dataset [22], which may in turn become a source of bias when investigating individuals originating from a distant past, where the average heterozygosity can be expected to be lower than that of modern populations.
This bias can however be mitigated within GRUPS-rs, through the use of the - - af-downsampling-rate parameter, which provides with a simple way to randomly simulate allele fixation within the reference panel at a fixed probability. In this same regard, our companion library, grups.plots, provides with utilities to obtain crude estimates of the divergence in heterozygosity between the reference panel and the samples being studied. Finding a reasonable value for this parameter may for example be obtained by calculating the average normalized ratios between either
the
the
the
As with many other kinship estimation methods, GRUPS-rs may be sensitive to the presence of long runs of Homozygosity (ROH) resulting from recent inbreeding. Thus, we hereby alert to the fact that the presence of inbred individuals may generate intermediate values of relatedness coefficients, which may in turn produce false positive results and/or be mistakenly interpreted as evidence for the presence of complex ties, such as those displayed in the Koszyce dataset. However, while GRUPS-rs currently does not provide with a correction scheme for inbreeding, the presence of such biases may be easily detected by using its - - self - comparison feature, since any fluctuation from the expected background genetic diversity of the sample libraries — be it from recent inbreeding, admixture, or a low effective population size, etc. —is quickly betrayed by an obvious discrepancy between the observed
While currently showcasing a simple scheme to account for sequencing error rates during simulations, attention must be brought to the fact that GRUPS-rs currently does not correct for the presence of post-mortem damages, apart from providing with a simple flag to filter out transitions (--exclude-transitions). As with many other ancient DNA softwares and methods, we thus highly recommend that users take the required preliminary steps to assess and eventually trim their data prior to using GRUPS-rs, though it should be noted that an elevated presence of deamination should in no way be expected to increase the amount of false positive results from this method.
These results demonstrate that GRUPS-rs is a fully-fledged, high-performance kinship estimation software well capable of estimating genetic ties from low-coverage ancient DNA, up to the third degree of relatedness.
While GRUPS may not have been used as widely as it could have, given its runtime requirements, the updated version of GRUPS-rs effectively addresses this initial limitation. As evidenced by the 14000:1 runtime performance gain displayed in GRUPS-rs, we also underline that the construction of finite state automata from VCF files may prove to be a relevant strategy to maximize the memory efficiency and I/O throughput of any program requiring specialized and/or repeated queries within massive sequence genotype variation databases.
Ultimately, we advance that its ability to operate on isolated pairs of individuals, while jointly taking into account the rate of modern human contamination, sequencing error rates, and the possibility of testing precisely-defined hypotheses of complex inbreeding scenarios make GRUPS-rs a useful, flexible, and constructive addition to the currently available pool of ancient DNA kinship estimation methods.
GRUPS-rs and its companion library grups.plots are available on Github, (https://github.com/MaelLefeuvre/grups-rs), will feature long-term code maintenance, and are open to open-source contributions and additional feature requests.
The following supplementary materials can be downloaded at: HPGG2404010001SupplementaryMaterials.zip:
Figure S1: Alternative template pedigrees on the Kozsyce dataset.
Figure S2: GRUPS-rs accuracy results on simulated dataset.
Figure S3: Hazleton-North samples pairwise SNP overlap.
Figure S4: Per-class performance metrics of GRUPS-rs and the Kennett method.
Figure S5: R-coefficient estimates of GRUPS-rs against the Kennett method.
Figure S6: Pedigree simulation results for the Koszyce dataset.
Table S1: Raw GRUPS-rs SVM probability results (Hazleton North dataset).
Table S2: Expected relatedness coefficients for the seven Koszyce individuals, under four scenarios of kinship between K14 and U0.2f.
Table S3: Raw GRUPS-rs benchmark results.
Table S4: Raw GRUPS-rs simulation results for the Kozsyce dataset (4 scenarios).
Not applicable.
Not applicable.
Our main software GRUPS-rs is available on Github: https://github.com/MaelLefeuvre/grups-rs. A snapshot of the version used during this study is available at Zenodo: https://doi.org/10.5281/zenodo.10389507 .
The companion shiny dashboard of GRUPS-rs grups.plot is available on Github: https://github.com/MaelLefeuvre/grups.plots. A snapshot of the version used during this study is available at Zenodo: https://doi.org/10.5281/zenodo.10389546.
All scripts, Snakemake workflows and jupyter-notebooks relating to the runtime, memory and performance assessment of GRUPS-rs are available on Github (https://github.com/MaelLefeuvre/grups-rs-benchmark) and Zenodo (https://doi.org/10.5281/zenodo.10389550)
This work is supported and funded by the regional program “Paris Region PhD 2021” of the region Ile-de-France (grant no. 19006503).
The authors have declared that no competing interests exist.
All authors provided critical feedback and helped shape the research, and direction of this project.
Maël Lefeuvre: Conceived of the presented project, carried out the implementation and analysis. Lead manuscript writer.
Michael D. Martin: Contributed to the design and direction of the project, and proofreading of the manuscript
Flora Jay: Contributed to the design and direction of the project, and proofreading of the manuscript.
Marie-Claude Marsolier: Project supervision. Contributed to the proofreading of the manuscript.
Céline Bon: Project supervision. Contributed to the proofreading of the manuscript
We thank Fayçal Allouti, and all members of the UAR 2700 2AD “Acquisition et Analyse de Données pour l’histoire naturelle”, for their scientific and technical support in providing computational resources.
The following abbreviations are used in this manuscript:
| 1. | Fowler C, Olalde I, Cummings V, Armit I, Buster L, Cuthbert S, et al. A high-resolution picture of kinship practices in an Early Neolithic tomb. Nature. 2022;601:584-587. [Google Scholar] [CrossRef] |
| 2. | Rivollat M, Rohrlach AB, Ringbauer H, Childebayeva A, Mendisco F, Barquera R, et al. Extensive pedigrees reveal the social organization of a Neolithic community. Nature. 2023;620:600-6. [Google Scholar] [CrossRef] |
| 3. | Vai S, Amorim CEG, Lari M, Caramelli D. Kinship Determination in Archeological Contexts Through DNA Analysis. Front Ecol Evol. 2020;8:83. [Google Scholar] [CrossRef] |
| 4. | Xu Y, Wang N, Gao S, Li C, Ma P, Yang S, et al. Solving the two-decades-old murder case through joint application of ZooMS and ancient DNA approaches. Int J Legal Med. 2023;137:319-327. [Google Scholar] [CrossRef] |
| 5. | Zupanič Pajnič I, Leskovar T, Črešnar M. Improving kinship probability in analysis of ancient skeletons using identity SNPs and MPS technology. Int J Legal Med. 2023;137:1007-1015. [Google Scholar] [CrossRef] |
| 6. | Budowle B, Arnette A, Sajantila A. A cost-benefit analysis for use of large SNP panels and high throughput typing for forensic investigative genetic genealogy. Int J Legal Med. 2023;137:1595-1614. [Google Scholar] [CrossRef] |
| 7. | Lipatov M, Sanjeev K, Patro R, Veeramah KR. Maximum Likelihood Estimation of Biological Relatedness from Low Coverage Sequencing Data. bioRxiv. 2015. [Google Scholar] [CrossRef] |
| 8. | Hanghøj K, Moltke I, Andersen PA, Manica A, Korneliussen TS. Fast and accurate relatedness estimation from high-throughput sequencing data in the presence of inbreeding. GigaScience. 2019;8:giz034. [Google Scholar] [CrossRef] |
| 9. | Martin MD, Jay F, Castellano S, Slatkin M. Determination of genetic relatedness from low-coverage human genome sequences using pedigree simulations. Mol Ecol. 2017;26:4145-57. [Google Scholar] [CrossRef] |
| 10. | Kennett DJ, Plog S, George RJ, Culleton BJ, Watson AS, Skoglund P, et al. Archaeogenomic evidence reveals prehistoric matrilineal dynasty. Nat Commun. 2017;8:14115. [Google Scholar] [CrossRef] |
| 11. | Kuhn JMM, Jakobsson M, Günther T. Estimating genetic kin relationships in prehistoric populations. PLOS ONE. 2018;13:e0195491. [Google Scholar] [CrossRef] |
| 12. | Popli D, Peyrégne S, Peter BM. KIN: a method to infer relatedness from low-coverage ancient DNA. Genome Biol. 2023;24:10. [Google Scholar] [CrossRef] |
| 13. | Fernandes DM, Cheronet O, Gelabert P, Pinhasi R. TKGWV2: an ancient DNA relatedness pipeline for ultra-low coverage whole genome shotgun data. Sci Rep. 2021;11:21262. [Google Scholar] [CrossRef] |
| 14. | Nyerki E, Kalmár T, Schütz O, Lima RM, Neparáczki E, Török T, et al. correctKin: an optimized method to infer relatedness up to the 4th degree from low-coverage ancient human genomes. Genome Biol. 2023;24:38. [Google Scholar] [CrossRef] |
| 15. | Marsh WA, Brace S, Barnes I. Inferring biological kinship in ancient datasets: comparing the response of ancient DNA-specific software packages to low coverage data. BMC Genomics. 2023;24:111. [Google Scholar] [CrossRef] |
| 16. | Guarino-Vignon P, Lefeuvre M, Chimènes A, Monnereau A, Guliyev F, Pecqueur L, et al. Genome-wide analysis of a collective grave from Mentesh Tepe provides insight into the population structure of early neolithic population in the South Caucasus. Commun Biol. 2023;6:1-10. [Google Scholar] [CrossRef] |
| 17. | De Angelis F, Romboni M, Veltre V, Catalano P, Martínez-Labarga C, Gazzaniga V, et al. First Glimpse into the Genomic Characterization of People from the Imperial Roman Community of Casal Bertone (Rome, First–Third Centuries AD). Genes. 2022;13:136. [Google Scholar] [CrossRef] |
| 18. | Cooke NP, Mattiangeli V, Cassidy LM, Okazaki K, Stokes CA, Onbe S, et al. Ancient genomics reveals tripartite origins of Japanese populations. Sci Adv. 2021;7:eabh2419. [Google Scholar] [CrossRef] |
| 19. | Ning C, Zhang F, Cao Y, Qin L, Hudson MJ, Gao S, et al. Ancient genome analyses shed light on kinship organization and mating practice of Late Neolithic society in China. iScience. 2021;24:103352. [Google Scholar] [CrossRef] |
| 20. | Fernandes D, Sirak K, Novak M, Finarelli JA, Byrne J, Connolly E, et al. The Identification of a 1916 Irish Rebel: New Approach for Estimating Relatedness From Low Coverage Homozygous Genomes. Sci Rep. 2017;7:41529. [Google Scholar] [CrossRef] |
| 21. | Matsakis ND, Klock FS. The rust language. Ada Lett. 2014;34:103-104. [Google Scholar] [CrossRef] |
| 22. | The 1000 Genomes Project Consortium. A global reference for human genetic variation. Nature. 2015;526:68-74. [Google Scholar] [CrossRef] |
| 23. | The International HapMap Consortium. A second generation human haplotype map of over 3.1 million SNPs. Nature. 2007;449:851-861. [Google Scholar] [CrossRef] |
| 24. | Peyrégne S, Peter BM. AuthentiCT: a model of ancient DNA damage to estimate the proportion of present-day DNA contamination. Genome Biol. 2020;21:246. [Google Scholar] [CrossRef] |
| 25. | Nakatsuka N, Harney É, Mallick S, Mah M, Patterson N, Reich D. ContamLD: estimation of ancient nuclear DNA contamination using breakdown of linkage disequilibrium. Genome Biol. 2020;21:199. [Google Scholar] [CrossRef] |
| 26. | Racimo F, Renaud G, Slatkin M. Joint Estimation of Contamination, Error and Demography for Nuclear DNA from Ancient Humans. PLOS Genet. 2016;12:e1005972. [Google Scholar] [CrossRef] |
| 27. | Haldane JBS. The combination of linkage values, and the calculation of distances between the loci of linked factors. J Genet. 1919;8:299-309. [Google Scholar] |
| 28. | Frank E, Hall M. A Simple Approach to Ordinal Classification. Machine Learning: ECML 2001. Lecture Notes in Computer Science. In: De Raedt L, Flach P, editor. Berlin, Heidelberg: Springer; 2001. p.145-156. [CrossRef] |
| 29. | Platt CJ. Probabilistic outputs for support vector machines and comparisons to regularized likelihood methods. Advances in large margin classifiers. In: Smola AJ, Bartlett P, Schölkopf B, Schuurmans D, editor. Cambridge, MA: MIT Press; 1999. p.61-74. |
| 30. | Lin HT, Lin CJ, Weng RC. A note on Platt’s probabilistic outputs for support vector machines. Mach Learn. 2007;68:267-276. [Google Scholar] [CrossRef] |
| 31. | Moraes D, Wainer J, Rocha A. Low false positive learning with support vector machines. J Vis Commun Image Represent. 2016;38:340-350. [Google Scholar] [CrossRef] |
| 32. | Bonfield JK, Marshall J, Danecek P, Li H, Ohan V, Whitwham A, et al. HTSlib: C library for reading/writing high-throughput sequencing data. GigaScience. 2021;10:giab007. [Google Scholar] [CrossRef] |
| 33. | Li H. Tabix: fast retrieval of sequence features from generic TAB-delimited files. Bioinformatics. 2011;27:718-719. [Google Scholar] [CrossRef] |
| 34. | Rabin MO, Scott D. Finite Automata and Their Decision Problems. IBM J Res Dev. 1959;3:114-125. [Google Scholar] [CrossRef] |
| 35. | Cameron M, Williams HE, Cannane A. A Deterministic Finite Automaton for Faster Protein Hit Detection in BLAST. J Comput Biol. 2006;13:965-978. [Google Scholar] [CrossRef] |
| 36. | Van der Jeugt F, Maertens R, Steyaert A, Verschaffelt P, De Tender C, Dawyndt P, et al. UMGAP: the Unipept MetaGenomics Analysis Pipeline. BMC Genomics. 2022;23:433. [Google Scholar] [CrossRef] |
| 37. | Khan J, Patro R. Cuttlefish: fast, parallel and low-memory compaction of de Bruijn graphs from large-scale genome collections. Bioinformatics. 2021;37:i177-i186. [Google Scholar] [CrossRef] |
| 38. | Daciuk J, Mihov S, Watson BW, Watson RE. Incremental Construction of Minimal Acyclic Finite-State Automata. Computational Linguistics. 2000;26:3-16. [Google Scholar] [CrossRef] |
| 39. | Gallant A. Index 1,600,000,000 Keys with Automata and Rust [Internet]. Andrew Gallant’s Blog; 2015 [cited Sep 2023]. Available from: https://blog.burntsushi.net/transducers/. |
| 40. | Caballero M, Seidman DN, Qiao Y, Sannerud J, Dyer TD, Lehman DM, et al. Crossover interference and sex-specific genetic maps shape identical by descent sharing in close relatives. PLOS Genet. 2019;15:e1007979. [Google Scholar] [CrossRef] |
| 41. | Renaud G, Hanghøj K, Willerslev E, Orlando L. gargammel: a sequence simulator for ancient DNA. Bioinformatics. 2017;33:577-579. [Google Scholar] [CrossRef] |
| 42. | Li H, Durbin R. Fast and accurate short read alignment with Burrows-Wheeler transform. Bioinformatics. 2009;25:1754-1760. [Google Scholar] [CrossRef] |
| 43. | Danecek P, Bonfield JK, Liddle J, Marshall J, Ohan V, Pollard MO, et al. Twelve years of SAMtools and BCFtools. GigaScience. 2021;10:giab008. [Google Scholar] [CrossRef] |
| 44. | Broad Institute. Picard: A set of command line tools (in Java) for manipulating high-throughput sequencing (HTS) data and formats such as SAM/BAM/CRAM and VCF. Version 2.27.4. 2022 [software]. Available from: http://broadinstitute.github.io/picard.. |
| 45. | Mallick S, Micco A, Mah M, Ringbauer H, Lazaridis I, Olalde I, et al. The Allen Ancient DNA Resource (AADR): A curated compendium of ancient human genomes. bioRxiv. 2023. [Google Scholar] [CrossRef] |
| 46. | Kuhn M. Building Predictive Models in R Using the caret Package. J Stat Softw. 2008;28:1-26. [Google Scholar] [CrossRef] |
| 47. | Saville A, Hall E, Hoyle J, Bartlett A, Bell M, Darvill T, et al. Hazleton North: The excavation of a Neolithic long cairn of the Cotswold-Severn group. Liverpool: Liverpool University Press; 1990. [CrossRef] |
| 48. | Meadows J, Barclay A, Bayliss A. A Short Passage of Time: the Dating of the Hazleton Long Cairn Revisited. Camb Archaeol J. 2007;17:45-64. [Google Scholar] [CrossRef] |
| 49. | Wilson EB. Probable Inference, the Law of Succession, and Statistical Inference. J Am Stat Assoc. 1927;22:209-212. [Google Scholar] [CrossRef] |
| 50. | Newcombe RG. Two-sided confidence intervals for the single proportion: comparison of seven methods. Statist Med. 1998;17:857-872. [Google Scholar] [CrossRef] |
| 51. | Mantel N. The Detection of Disease Clustering and a Generalized Regression Approach. Cancer Res. 1967;27:209-220. [Google Scholar] |
| 52. | Oksanen J, Simpson GL, Blanchet FG, Kindt R, Legendre P, Minchin PR, et al. vegan: Community Ecology Package. Version 2.6-4; 2022 [software]. Available from: https://CRAN.R-project.org/package=vegan. |
| 53. | Wilcoxon F. Individual Comparisons by Ranking Methods. Biometrics Bulletin. 1945;1:80-83. [Google Scholar] [CrossRef] |
| 54. | Schroeder H, Margaryan A, Szmyt M, Theulot B, Włodarczak P, Rasmussen S, et al. Unraveling ancestry, kinship, and violence in a Late Neolithic mass grave. Proc Natl Acad Sci USA. 2019;116:10705-10710. [Google Scholar] [CrossRef] |
| 55. | Jónsson H, Ginolhac A, Schubert M, Johnson PLF, Orlando L. mapDamage2.0: fast approximate Bayesian estimates of ancient DNA damage parameters. Bioinformatics. 2013;29:1682-1684. [Google Scholar] [CrossRef] |
| 56. | Jun G, Wing MK, Abecasis GR, Kang HM. An efficient and scalable analysis framework for variant extraction and refinement from population scale DNA sequence data. Genome Res. 2015;gr.176552.114. [Google Scholar] [CrossRef] |
| 57. | Rohland N, Mallick S, Mah M, Maier R, Patterson N, Reich D. Three assays for in-solution enrichment of ancient human DNA at more than a million SNPs. Genome Res. 2022;32:2068-2078. [Google Scholar] [CrossRef] |
| 58. | Davidson R, Williams MP, Roca-Rada X, Kassadjikova K, Tobler R, Fehren-Schmitz L, et al. Allelic bias when performing in-solution enrichment of ancient human DNA. Mol Ecol Resour. 2023;23:1823-1840. [Google Scholar] [CrossRef] |
| 59. | Flegontov P, Işıldak U, Maier R, Yüncü E, Changmai P, Reich D. Modeling of African population history using f-statistics is biased when applying all previously proposed SNP ascertainment schemes. PLOS Genet. 2023;19:e1010931. [Google Scholar] [CrossRef] |
| 60. | Rubinacci S, Ribeiro DM, Hofmeister RJ, Delaneau O. Efficient phasing and imputation of low-coverage sequencing data using large reference panels. Nat Genet. 2021;53:120-126. [Google Scholar] [CrossRef] |
| 61. | Rubinacci S, Hofmeister RJ, Sousa da Mota B, Delaneau O. Imputation of low-coverage sequencing data from 150,119 UK Biobank genomes. Nat Genet. 2023;55:1088-1090. [Google Scholar] [CrossRef] |
| 62. | Ringbauer H, Novembre J, Steinrücken M. Parental relatedness through time revealed by runs of homozygosity in ancient DNA. Nat Commun. 2021;12:5425. [Google Scholar] [CrossRef] |

![]()
Copyright © 2026 Pivot Science Publications Corp. - unless otherwise stated | Terms and Conditions | Privacy Policy


