1. Introduction
Historically, the Eastern Eurasian Steppe has served as the home for numerous nomadic empires. The first nomadic empire founded by pastoralists was the Xiongnu, which occupied East and Central Asia from the third century BCE to the first century CE [1,2]. Encompassing the expansive territory covering the eastern Eurasian Steppe and its surrounding regions in northern China, southern Siberia, and Central Asia and commanding the hub regions of the Silk Road, the Xiongnu fostered exchanges of materials, ideas, and people across the diverse parts of Eurasia. Recent archaeogenomic studies have provided an answer to a long-standing question of the genetic profiles of the Xiongnu people [3–6]. These studies highlighted dynamic changes in the genetic profiles of people in the Eastern Eurasian Steppe before and during the Xiongnu period, as well as in the subsequent Mongol Empire era.
Still, the complex history of the populations in the Eastern Eurasian Steppe between Xiongnu and Mongol Empires has been only superficially investigated mostly only with uniparental markers. Meanwhile ancient genomes from this long period remain scarce [7–10]. In particular, targeted investigation on the post-Xiongnu and pre-Mongol period is needed to fill in the knowledge gap. Previous studies have given a hint on the continued genetic changes during this period: while ancient individuals from the Xianbei (100–250 CE) [11] and Rouran (300–550 CE) [12] periods showed overall low genetic heterogeneity with a high proportion of their ancestry derived from the eastern Eurasian ancestral populations, the following Turkic (552–742 CE) and Uyghur (744–840 CE) period individuals showed highly heterogeneous genetic profiles presumably due to a recent mixture with Central Asian populations harboring an Iranian- or Bactria-Margiana Archaeological Complex (BMAC) related ancestry [3]. Medieval individuals from the Central Eurasian Steppe, from the Turkic and later periods (e.g., Kimak, Kipchak, and Karakhanid), show a similar genetic pattern with the Turkic/Uyghur period individuals from the Eastern Steppe [5]. Still, these tentative results are based on a small number of ancient genomes scattered across a large spatiotemporal space, thus unlikely to illuminate the whole dynamic history of the Medieval Eastern Steppe populations. The ancient individuals from the Uyghur period so far studied are clearly differentiated from the later individuals from the Mongol period, suggesting yet another major change in the population composition in between [3].
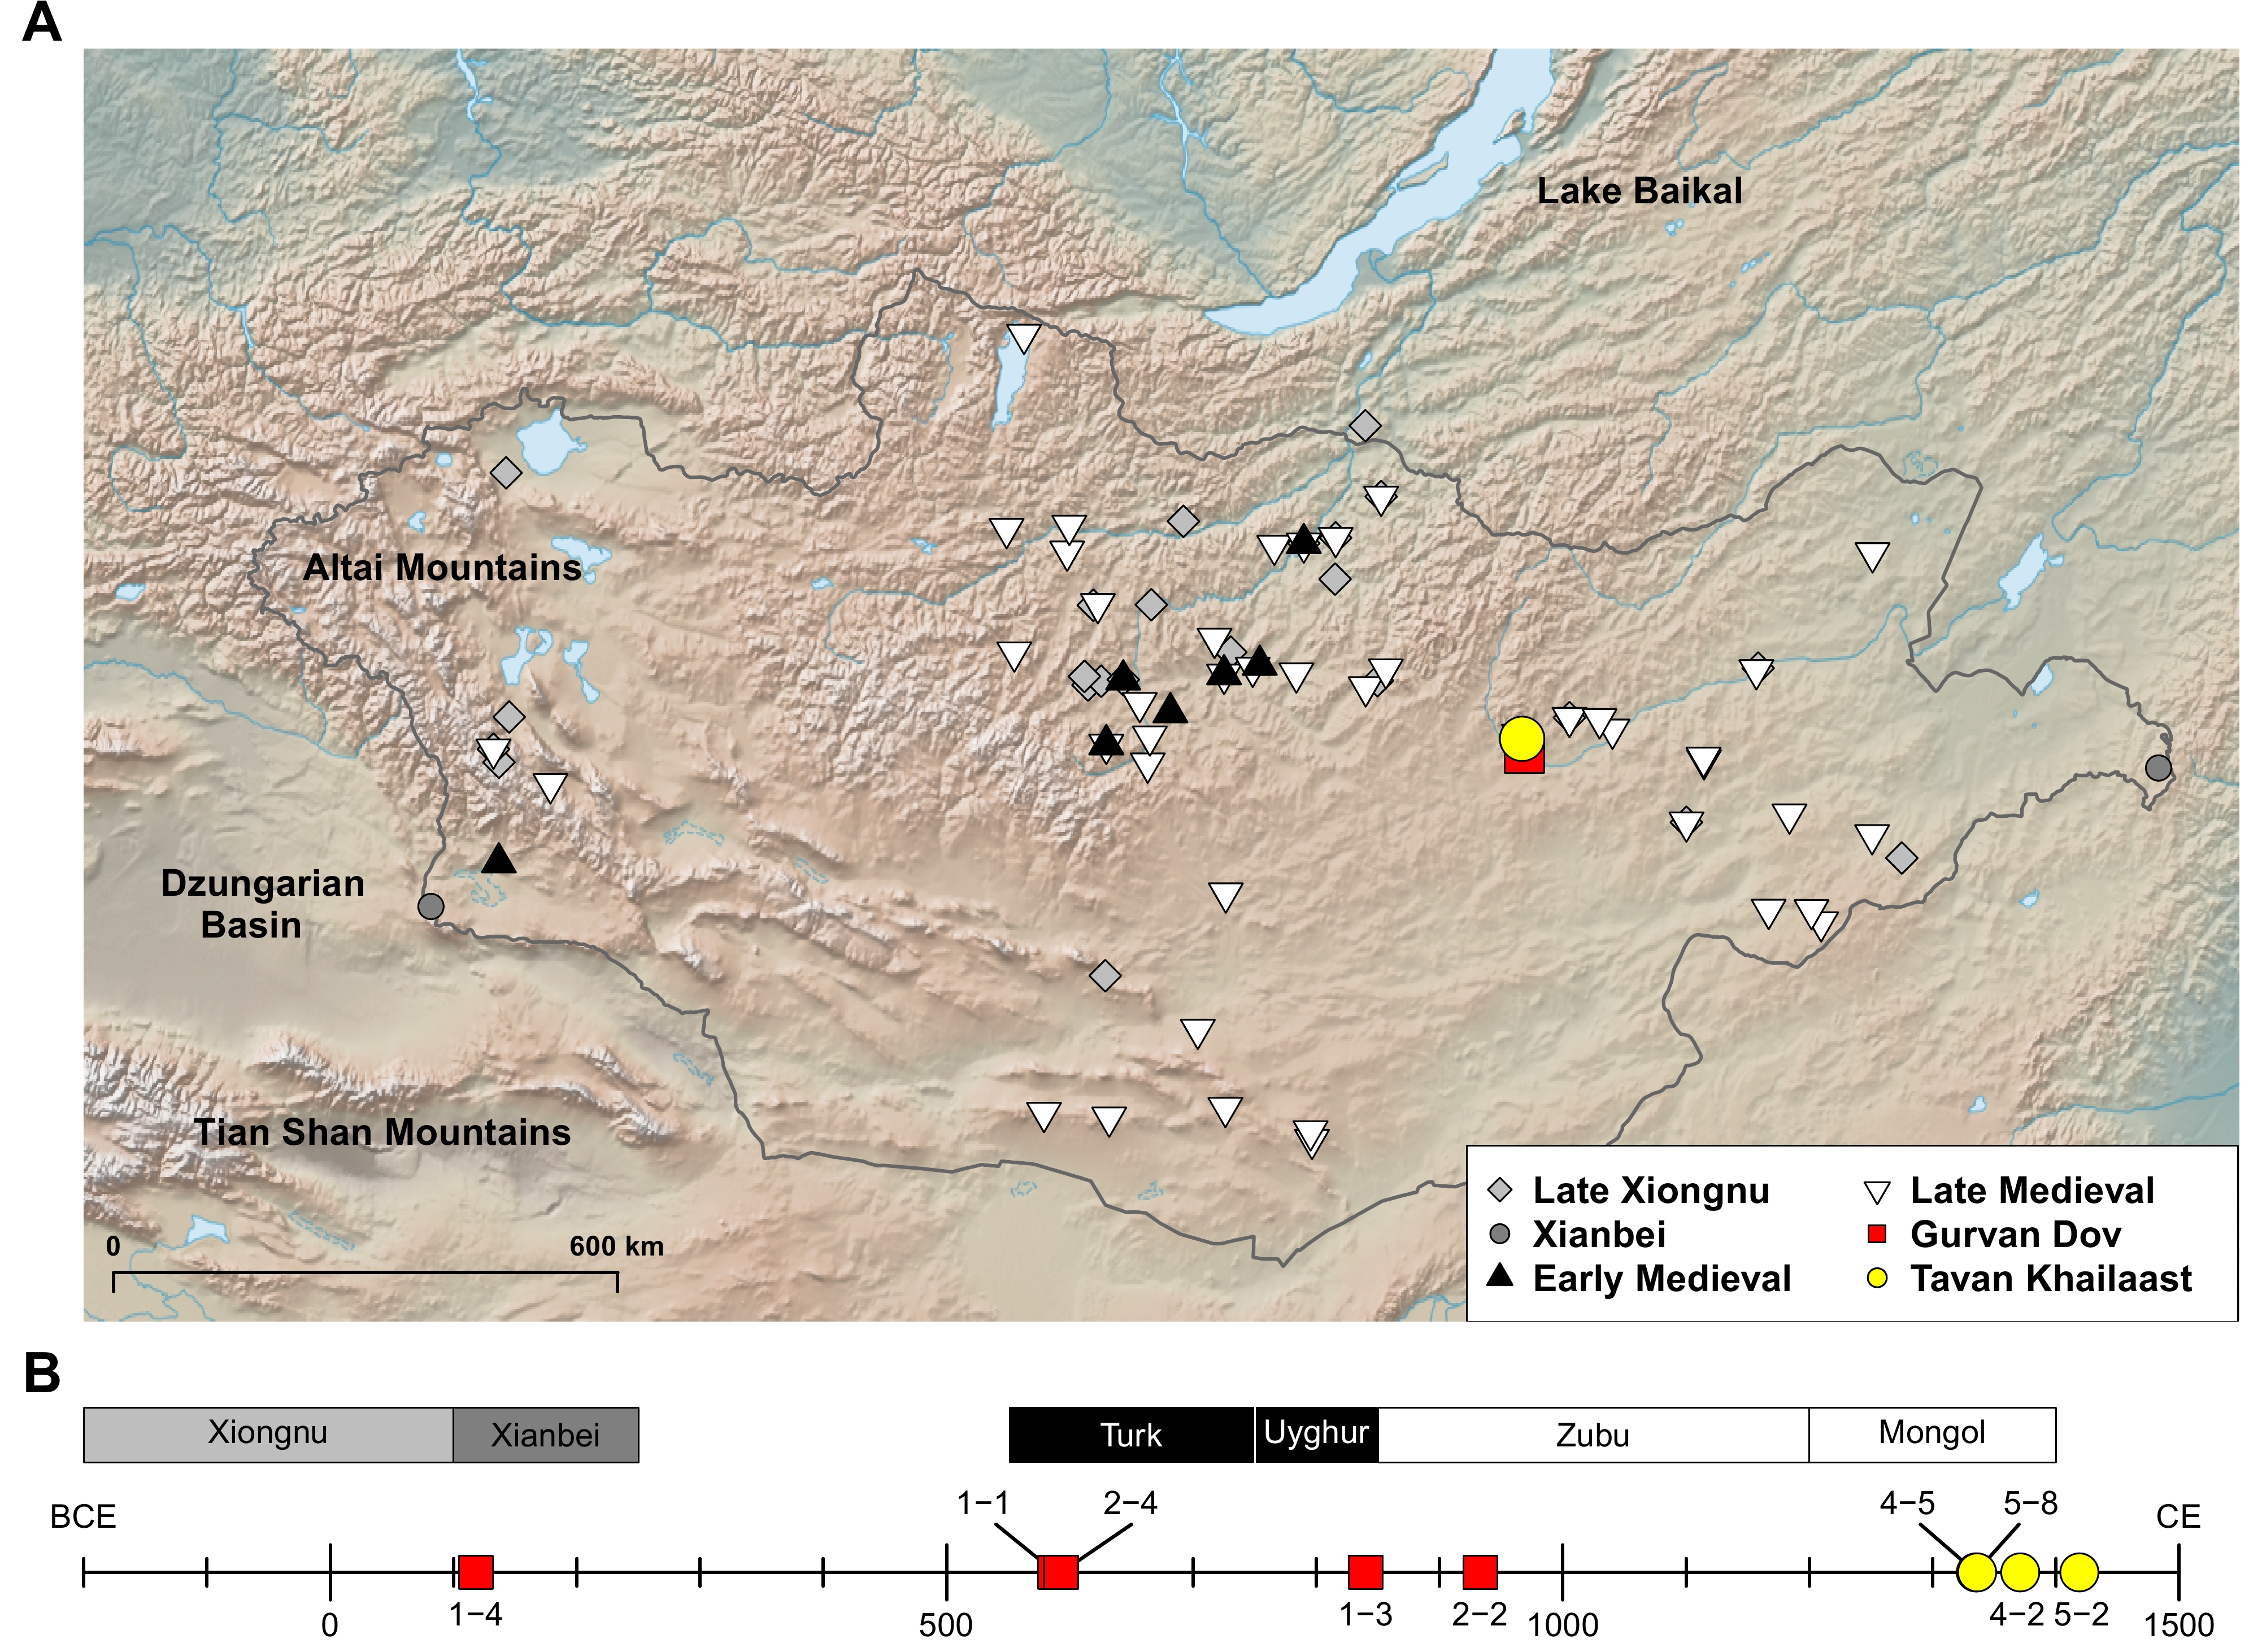
In this study, we investigated a local time transect across the Medieval period in Mongolia by generating whole genome sequencing data of nine ancient individuals. They were excavated from two cemeteries in eastern Mongolia, located 18 km apart from each other: five from Gurvan Dov (GD) and four from Tavan Khailaast (TK) (Figure 1 and Table S1). By adding these Medieval genomes from the two cemeteries to the existing data set of ancient genomes from Mongolia and neighboring regions, we give insight into the dynamics of the Medieval periods, especially to the microspatial genetic changes of eastern Mongolia.
2. Methods
2.1 Archaeological contexts of the Gurvan Dov cemetery
The Gurvan Dov archeological site is located in southern Delgerkhaan District in Khentii Aimag (Province), Mongolia (47.0155N, 109.0636E; 1,171 m elevation). The site encompasses three circular mounds of piled earth, and a collaborative Mongolian-Japanese survey team, consisting of archaeologists from the Mongolian Academy of Sciences and Niigata University in Japan, conducted excavations on two of them. Mound 1 was excavated in 2016, 2017, and 2019, and Mound 2 was excavated in 2018. Mound 1 is the largest among the three with a diameter of 29 meters and a height of 1.3 meters. Mound 2 measures between 18.5 and 20 meters in diameter and stands at a height of 1 meter. Both mounds were constructed using the ‘rammed-earth method,’ involving two key steps: flattening the original ground surface by scraping and covering it with a smooth layer of clay, approximately 2-3 cm thick. Each mound yielded eight tombs for excavation. In this study, we obtained ancient DNA data from human remains discovered within both Mounds 1 and 2. Further information about the GD burials are provided in Table S1.
2.2 Archaeological contexts of the Tavan Khailaast cemetery
The Tavan khailaast site is located in Delgerkhaan District, Khentii Aimag, Mongolia (47.1711N, 109.0238E; 1,483 m elevation). This site comprises 14 tombs arranged in a linear fashion along the contour line within a small valley, extending from the southwest to the northeast. Specifically, the six tombs on the southwest side are referred to as ‘Site 4’, while the remaining eight tombs on the northeast side are designated as ‘Site 5’. At Site 4, six tombs were excavated (Graves 1 and 2 in 2013; Graves 3−6 in 2014), while at Site 5, eight tombs were excavated (Graves 1 and 8 in 2013; Graves 5 and 7 in 2014; Graves 2−4 and 6 in 2015) by the collaborative Mongolian-Japanese survey team. Further information about the TK burials is provided in Table S1.
2.3 Ancient DNA recovery and sequencing
We extracted genomic DNA for six individuals excavated from Gurvan Dov (GD) and four individuals excavated from Tavan Khailaast (TK) using the modified Gamba’s method [13]. For these individuals, we prepared double stranded DNA sequencing libraries using NEBNext® Ultra™ II DNA Library Prep kit with partial uracil–DNA–glycosylase treatment. We also added both P5 and P7 Illumina adapters for double indexing. We conducted the DNA extraction and library preparation processes in a dedicated ancient DNA clean room facility at the Institute for the Study of Ancient Civilization and Cultural Resources, Kanazawa University, Japan. Then we sequenced six libraries of GD individuals on the Illumina HiSeq 2000 platform in Kanazawa University to generate paired-end 92 base pair (bp) sequences. Four libraries of TK individuals were sequenced on the Illumina HiSeq 2000 platform in Kanazawa University to generate paired-end 101 bp sequences. The output sequences were demultiplexed allowing at most one mismatch for each index.
2.4 DNA sequence data processing
We collapsed overlapping paired-end (PE) reads using AdapterRemoval v2.3.0 [14] and mapped collapsed reads with 35 bp or longer to the human reference genome with decoy sequences (hs37d5) using BWA aln/samse v0.7.17 [15]. Then we removed PCR duplicates with DeDup v0.12.5 [16] and kept uniquely mapped reads with Phred-scaled mapping quality score 30 or higher for the downstream analyses using samtools v1.9 [17]. We verified the authenticity of data by tabulating post-mortem chemical modifications using mapDamage v2.0.9 [18] and estimating nuclear and mitochondrial contamination levels using the ANGSD contamination module v0.929 [19] and the Schmutzi program with the option “--lengthDeam 2” [20], respectively.
2.5 Genotyping and data compilation
To minimize the biases resulting from the low coverage data and post-mortem damages, we performed pseudo-haploid genotype calling in the following steps, considering the damage pattern specific to the libraries made with the Ultra II kit (Figure S1). First, we masked terminal 5 bp at the 5’ end of each collapsed read, which shows a residual C>T misincorporation, using BamUtil v1.0.15 with option “trimBam” [21]. Second, we extracted positive strand reads with the command “samtools view -F 0x0010” and negative strand reads with the command “samtools view -f 0x0010” from the trimmed BAM files [17]. We used only the positive strand reads to genotype C/T SNPs and only the negative strand reads to genotype G/A SNPs. For the remaining SNPs that are not affected by the damages, we used both positive and negative strand reads from the trimmed BAM files. For each SNP locus, we randomly chose a high-quality base (base quality score 30 or higher) from a high-quality read (mapping quality score 30 or higher) and used the chosen base to represent a homozygous genotype (“pseudo-haploid genotype”). For this, we used the pileupCaller program v1.5.2 with option “--randomHaploid” (https://github.com/stschiff/sequenceTools). Then we merged newly generated genotype data with the previously published genotype data of present-day [22–28] and ancient individuals [3–6,11,12,29–33]. These datasets had been genotyped on the two SNP sets: the Affymetrix Axiom Genome-Wide Human Origins 1 array (“HumanOrigins”) [24] and a set of 1,233,013 SNPs including the HumanOrigins SNPs (“1240K”) [31,34] (Table S2).
2.6 Per individual assessment
We calculated autosomal, X, Y, and MT coverage of each individual at SNP positions from the 1240K panel and whole mitochondrial positions using the “depth” module in samtools v1.9 [17]. For the coverage calculation, we used bam files masking the terminal 5 bp at 5’ end. We removed one individual (GD2-3) for insufficient coverage for downstream analyses (<0.004x autosomal coverage). We performed in-depth population genetic analysis using the remaining nine individuals. We also determined the genetic sex of each individual based on the comparison between coverage of autosomal and sex chromosome regions. Specifically, individuals exhibiting a Y-to-autosome ratio exceeding 0.4 are classified as males, those with a ratio below 0.1 are classified as females (Figure S2). Next, we assigned the MT and Y chromosomal haplogroups. For mitochondrial haplogroups, we first used log2fasta program in the Schmutzi package to generate the mitochondrial consensus sequences with quality of 10 or higher (using “-q 10” flag) [20] and then used HaploGrep2 to assign MT haplogroups [35]. For Y chromosomal haplogroups of the males, we first used pileupCaller v1.4.0.5 option “majorityCall” to call 13,508 Y chromosome SNPs from the ISOGG database and then used a modified version of the yHaplo program [36] (https://github.com/alexhbnr/yhaplo; version 2016.01.08).
2.7 Estimation of genetic relatedness
To detect the close genetic relatives, we estimated the pairwise mismatch rate (pmr) of each pair of individuals [37]. Specifically, for each pair of individuals we calculated the ratio of the number of mismatched sites to the total number of non-missing sites between the two individuals in the pair, using pseudo-haploid genotypes for the autosomal SNPs in the 1240K panel. These pmr values were utilized to calculate the kinship coefficients. Assuming most individual pairs are unrelated, we took the mode of all pmr values calculated for all pairs of individuals as the estimate for the baseline pmr value for pairs of unrelated individuals (Figure S3). In addition, we used lcMLkin to calculate the probability of sharing zero, one or two alleles identical by descent (k0, k1, and k2 for each) for every pair of individuals, especially to distinguish between the parent-offspring and full siblings [38]. We also identified inbred individuals using hapROH, which detects genetic segments devoid of heterozygous sites and infers the degree of inbreeding based on the distribution of these segments [39].
2.8 Population genetic analysis
We first ran smartpca with 2,077 present-day Eurasian individuals using the HumanOrigins dataset to calculate eigenvectors for PCA analysis (Table S2) [40]. Then ancient individuals were projected onto the calculated eigenvectors with the option “lsqproject: YES” [23]. Given that most of the ancient individuals from Mongolia and neighboring regions are well explained as a mixture between the western and eastern Eurasia, and that the top Eurasian PCs explain the genetic differentiation between western and eastern Eurasians, we used PC values to compare the genetic heterogeneity of the ancient individuals [3,4,6]. We used mean and variance of PCs to compare the overall affinity to the eastern Eurasian populations and the genetic heterogeneity of GD and TK individuals with previously published ancient individuals. To statistically test the low genetic heterogeneity and high eastern Eurasian affinity of GD and TK individuals, we repeated random sampling and calculated the empirical p-value. Specifically, we randomly selected individuals from the merged set of the published [3,4,6,11] and newly analyzed individuals in this study. During the random sampling, we matched the time period distribution of each randomly sampled set with that of GD and TK. We repeated the random sampling for 1,000 times and calculated the empirical p-value by (n+1)/(1,000+1). The n implies the number of random sets with equal or more extreme quantity than the true data set: i.e., the number of the random sets with higher mean or lower variance than GD and TK. We also applied the same analysis to show four GD individuals have higher genetic heterogeneity to the eastern Eurasians and TK individuals have lower genetic heterogeneity than the previously published individuals. We also ran ADMIXTURE v1.3.0 to obtain an alternative summary of the genetic profiles of 1,774 present-day Eurasians and 207 ancient individuals, using HumanOrigins dataset [41]. We first removed SNPs with minor allele frequency lower than 5% using “--maf 0.05” command in PLINK v1.90b6.26 [42]. Then we generated the pruned set of SNPs which are in approximate linkage equilibrium and have missing rate lower than 10% using “--indep-pairwise 200 25 0.5 --geno 0.1” command in PLINK. With the 169,932 pruned SNPs, we ran ADMIXTURE for K values from two to ten. We ran 10 replicates for each K value with random seed values and took one with the highest log likelihood value [41].
We also calculated outgroup-f3 statistics for GD and TK individuals. We first grouped them into five populations, GD_Xiongnu-Xianbei, GD_Turk, GD_Uyghur and TK_Mongol, based on their time periods. Then, we used qp3Pop v651 from admixtools v7.0 on the 1240K dataset to calculate f3 statistics in the form of f3(Mbuti; GD/TK, X) [24]. Top 30 populations with more than 20,000 SNPs are shown in Figure S4.
We then tried to explain ancient individuals as combinations of the source populations and calculated the proportions of their ancestral populations. The source populations are chosen based on the position of each individual on the PC space and the previously published studies [3]. For these analyses, we ran the qpWave v1520 and qpAdm v1520 programs in admixtools v7.0 package with the 1240K dataset [23]. We used the following set of 10 populations as the base outgroup set (“right population”): central African rainforest hunter-gatherer (Mbuti, n=5), Andamanese islander (Onge, n=2), Taiwanese Aborigine (Ami, n=2), Central American (Mixe, n=3), Epipaleolithic Levantine (Natufian, n=6) [23], Neolithic Iranians from the Ganj Dareh archaeological site (Iran_N, n=8) [23,33], Epipaleolithic European hunter-gatherer (Villabruna, n=1) [43], Anatolian Neolithic from the Barcin site (Anatolia_N, n=23) [31], Eneolithic hunter-gatherer from northern Kazakhstan (Botai_pub, n=3) [44], and Neolithic individuals from southern Russia (West_Siberia_N, n=3) [33]. To compare the competing models, we added source populations to the base outgroup set one by one and repeatedly ran qpAdm, which is called a “rotating approach” [45].
3. Results
3.1 Medieval genomes from eastern Mongolia
We initially extracted genomic DNA of the 10 Medieval individuals excavated from the two cemeteries, GD and TK. Among the six GD individuals, one is from the Xiongnu-Xianbei period (GD1-4), two from the Turkic period (GD1-1 and GD2-4), one from the Uyghur Khaganate period (GD1-3), one from the Zubu period (GD2-2), and one from the Mongol period (GD2-3). The four TK individuals (TK4-2, TK4-5, TK5-2 and TK5-8) are from the Mongol period (Figure 1 and Table S1).
We found that nine out of 10 individuals, excluding one Mongol-period individual (GD2-3), yielded sufficient genome-wide coverage after whole genome sequencing and carried them to an in-depth quality control and downstream analysis (Table 1). We confirmed that all nine individuals showed the post-mortem damage patterns typical of ancient DNA and the library preparation protocol used in this study (Figure S1) [13] and that all of them showed low levels of contamination using mitochondrial (MT) sequences of all nine individuals and X chromosomal sequences of the five males (Table 1). We then determined pseudo-haploid genotypes for a set of 1,233,013 ancestry-informative single-nucleotide polymorphisms (SNPs), known as the “1240K” panel [31,34], with the pileupCaller program. For each individual, we retrieved between 329,619 and 1,053,197 SNPs covered by at least one high-quality read. We merged this newly generated genotype data with the previously published genotype data set of present-day [22–28] and ancient individuals [3–6,11,12,22,23,29–33,43,44,46–70].
We also determined the MT and Y haplogroups and investigated the genetic relatedness among individuals (Table 1 and Table S3). Among the two GD males, the Uyghur period one (GD1-3) is assigned to Y haplogroup J2a, belonging to the western Eurasian Y haplogroups, and the Turkic period one (GD2-4) is assigned to D-M174. All three Mongol period males from Tavan Khailaast (TK) carry Y haplogroup C2b. GD individuals are assigned to MT haplogroup A, B, F, G, or T and TK individuals are assigned to D4 or Y1, which are derived from M or N, and prevalent in the present-day Eastern Steppe. Their MT and Y haplogroups have been reported for the previously published ancient individuals from the contemporaneous time period (Table S4). Among the four TK individuals, we found a mother-son pair (TK5-8 and TK5-2) sharing the MT haplogroup Y1a1 (Table 1, Table S3, Figure S3). We also found three pairs of third-degree paternal relatives: TK5-2, the son in the mother-son pair, is a third degree relative of TK4-2 and TK4-5, who in turn are third degree relatives of each other (Table S3, Figure S3). In addition, we ran hapROH, an analysis to detect the Runs of Homozygosity (ROH), to estimate the rate of inbreeding for each individual (Figure S5) [39]. GD1-1 has the largest amount of ROH blocks, but none of the individuals have ROH longer than 20 cM, which suggests no one is an inbred individual.
3.2 Limited heterogeneity in the genetic profile of GD/TK individuals over a millennium
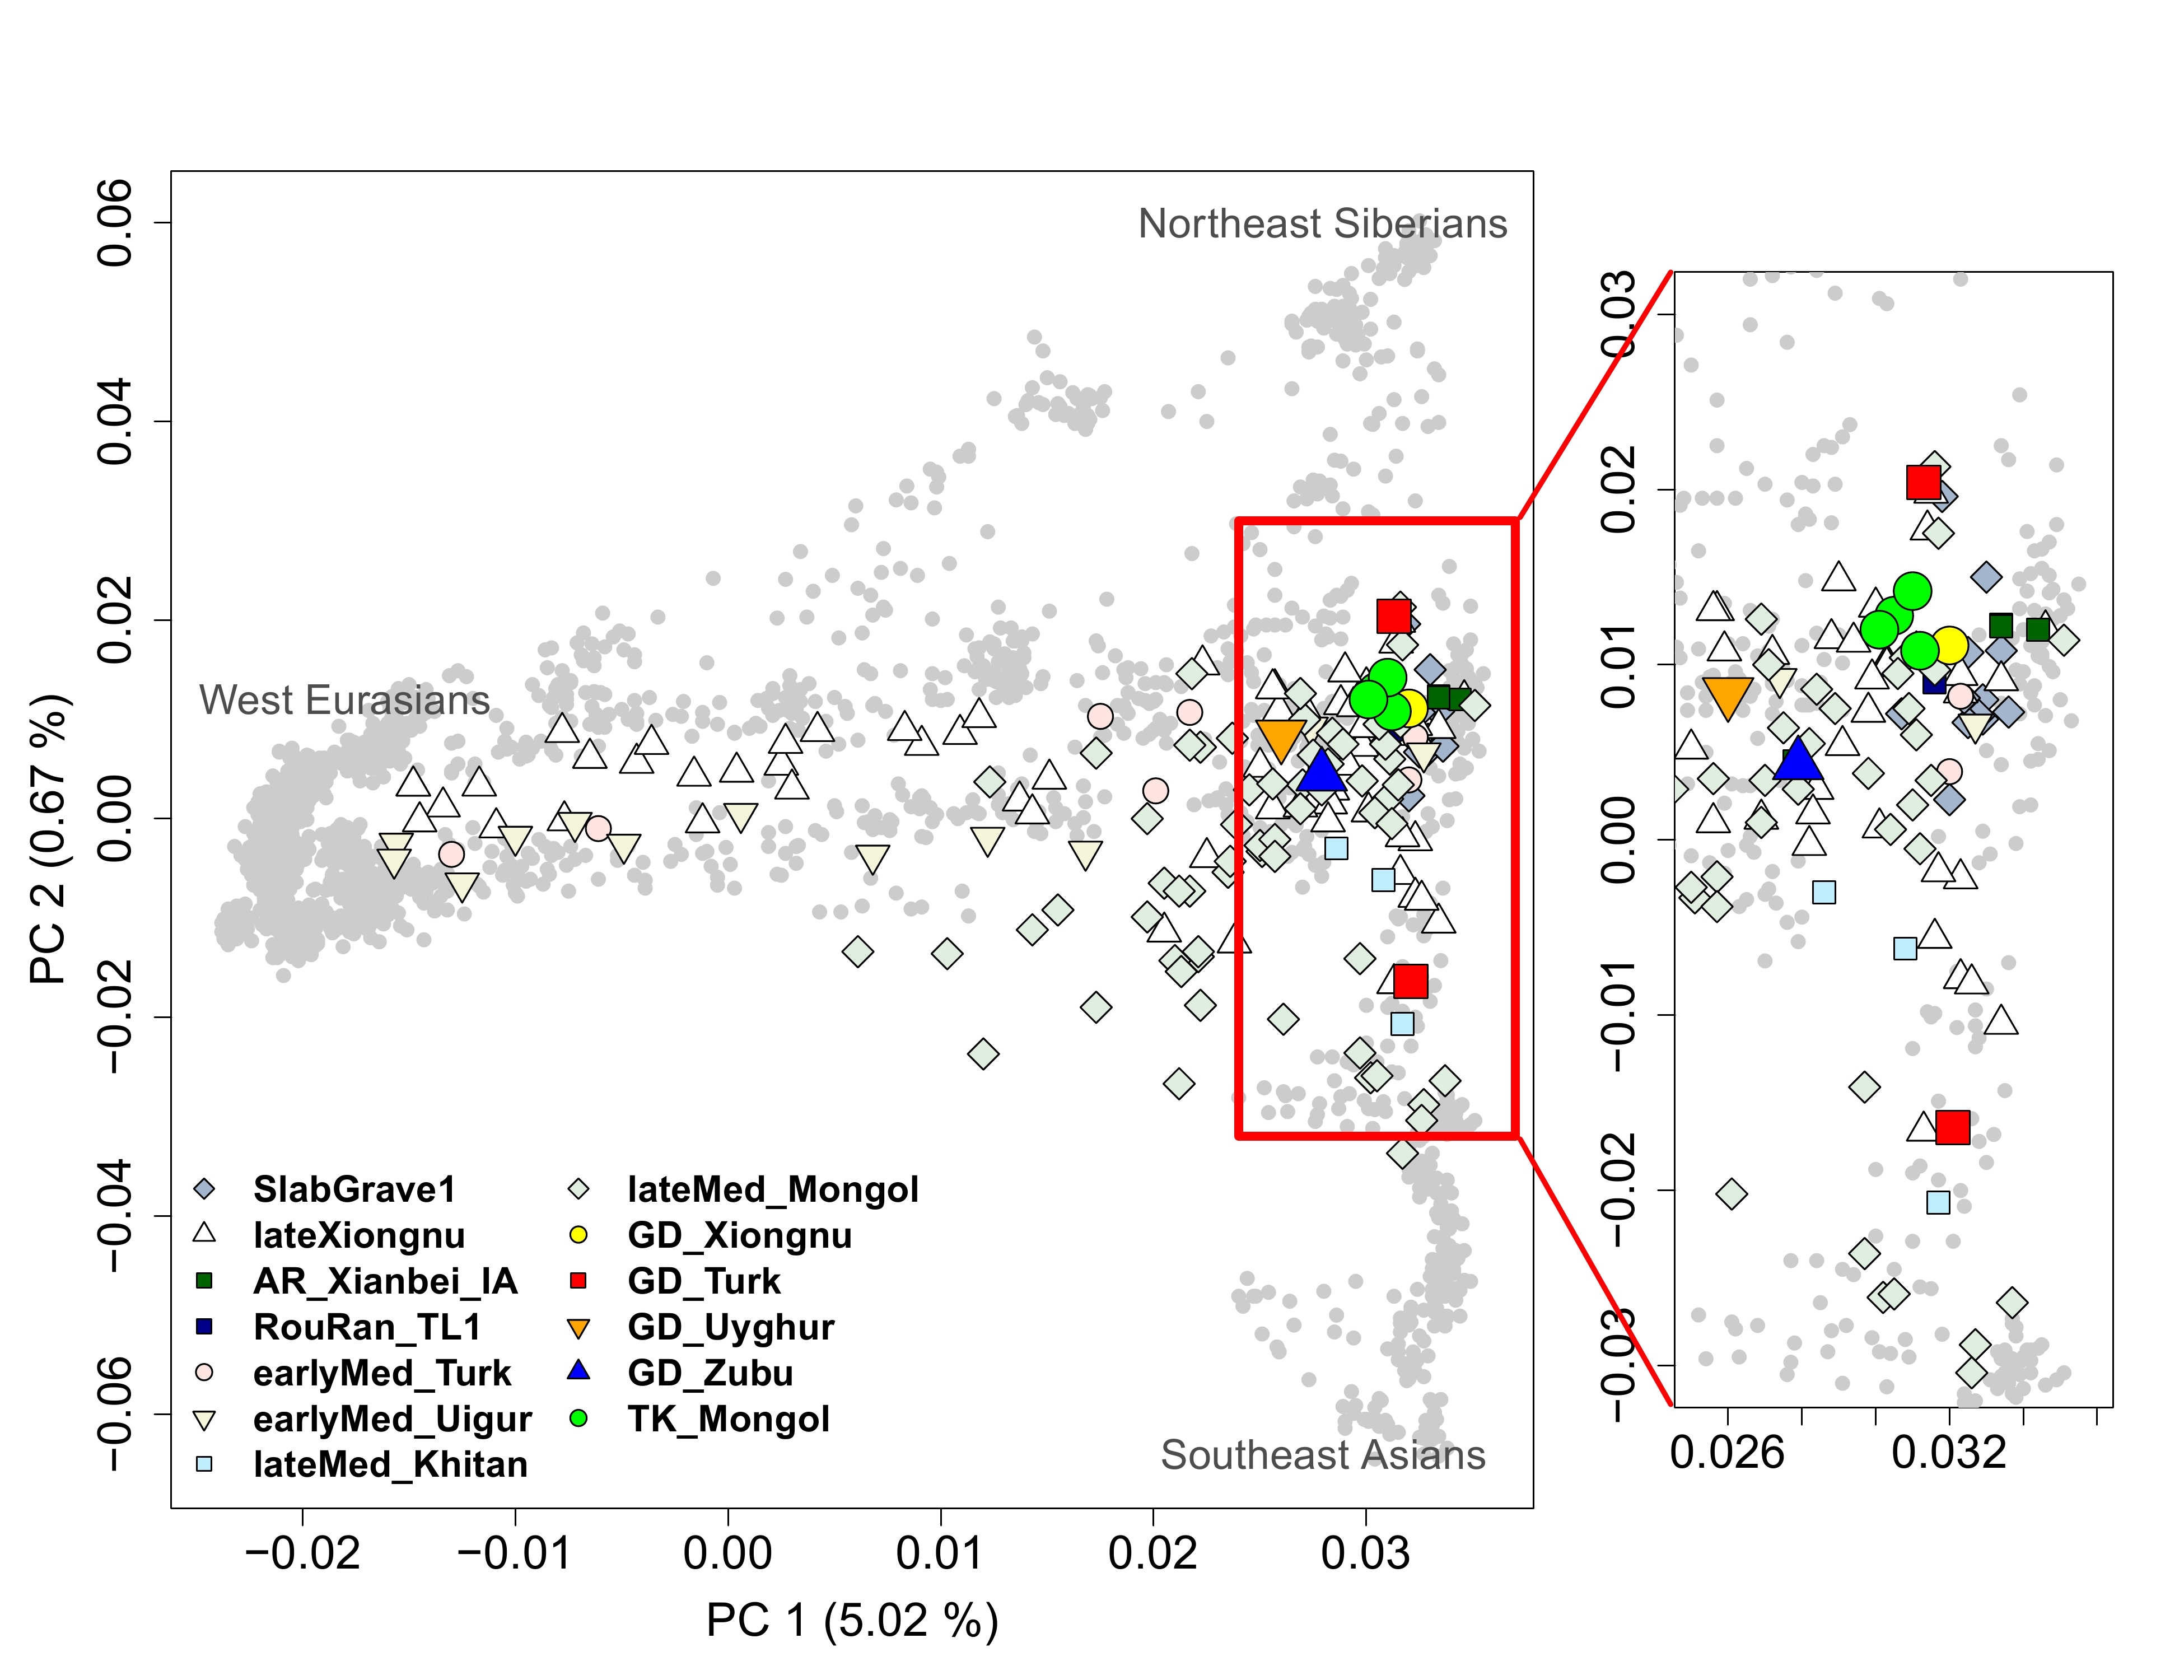
To characterize the genetic profiles of GD/TK individuals, we performed principal component analysis (PCA) and ADMIXTURE of Eurasian populations [40,41]. PCA results show that the nine individuals fall within the genetic heterogeneity observed in the previously reported Xiongnu- or Mongol-era individuals (Figure 2 and Figure S6) [3,4,6,11]. PC1 separates Eurasians along the west-east clines, and PC2 explains north-south clines of eastern Eurasians. Along the west-east cline on PC1, GD/TK individuals fall close to the eastern Eurasian individuals, in particular to ancient and present-day individuals from northeast Asia, who share a genetic profile frequently referred to as the Ancient Northeast Asian (ANA) [3]. The GD individuals are more heterogeneous in their genetic profiles among individuals than the TK individuals, presumably reflecting their much longer temporal span (from Xiongnu to Zubu) as well as the genetic heterogeneity within each time period. The ADMIXTURE analysis also provides qualitatively similar results with PCA (Figure S7 and Figure S8). Specifically, in K=8 showing the lowest cross validation error (Figure S7), GD and TK individuals derive a majority of their ancestry from a component maximized in the ANA-related individuals (64–79%; colored in red) with a negligible amount of western Eurasian-related ancestry components (Figure S8).
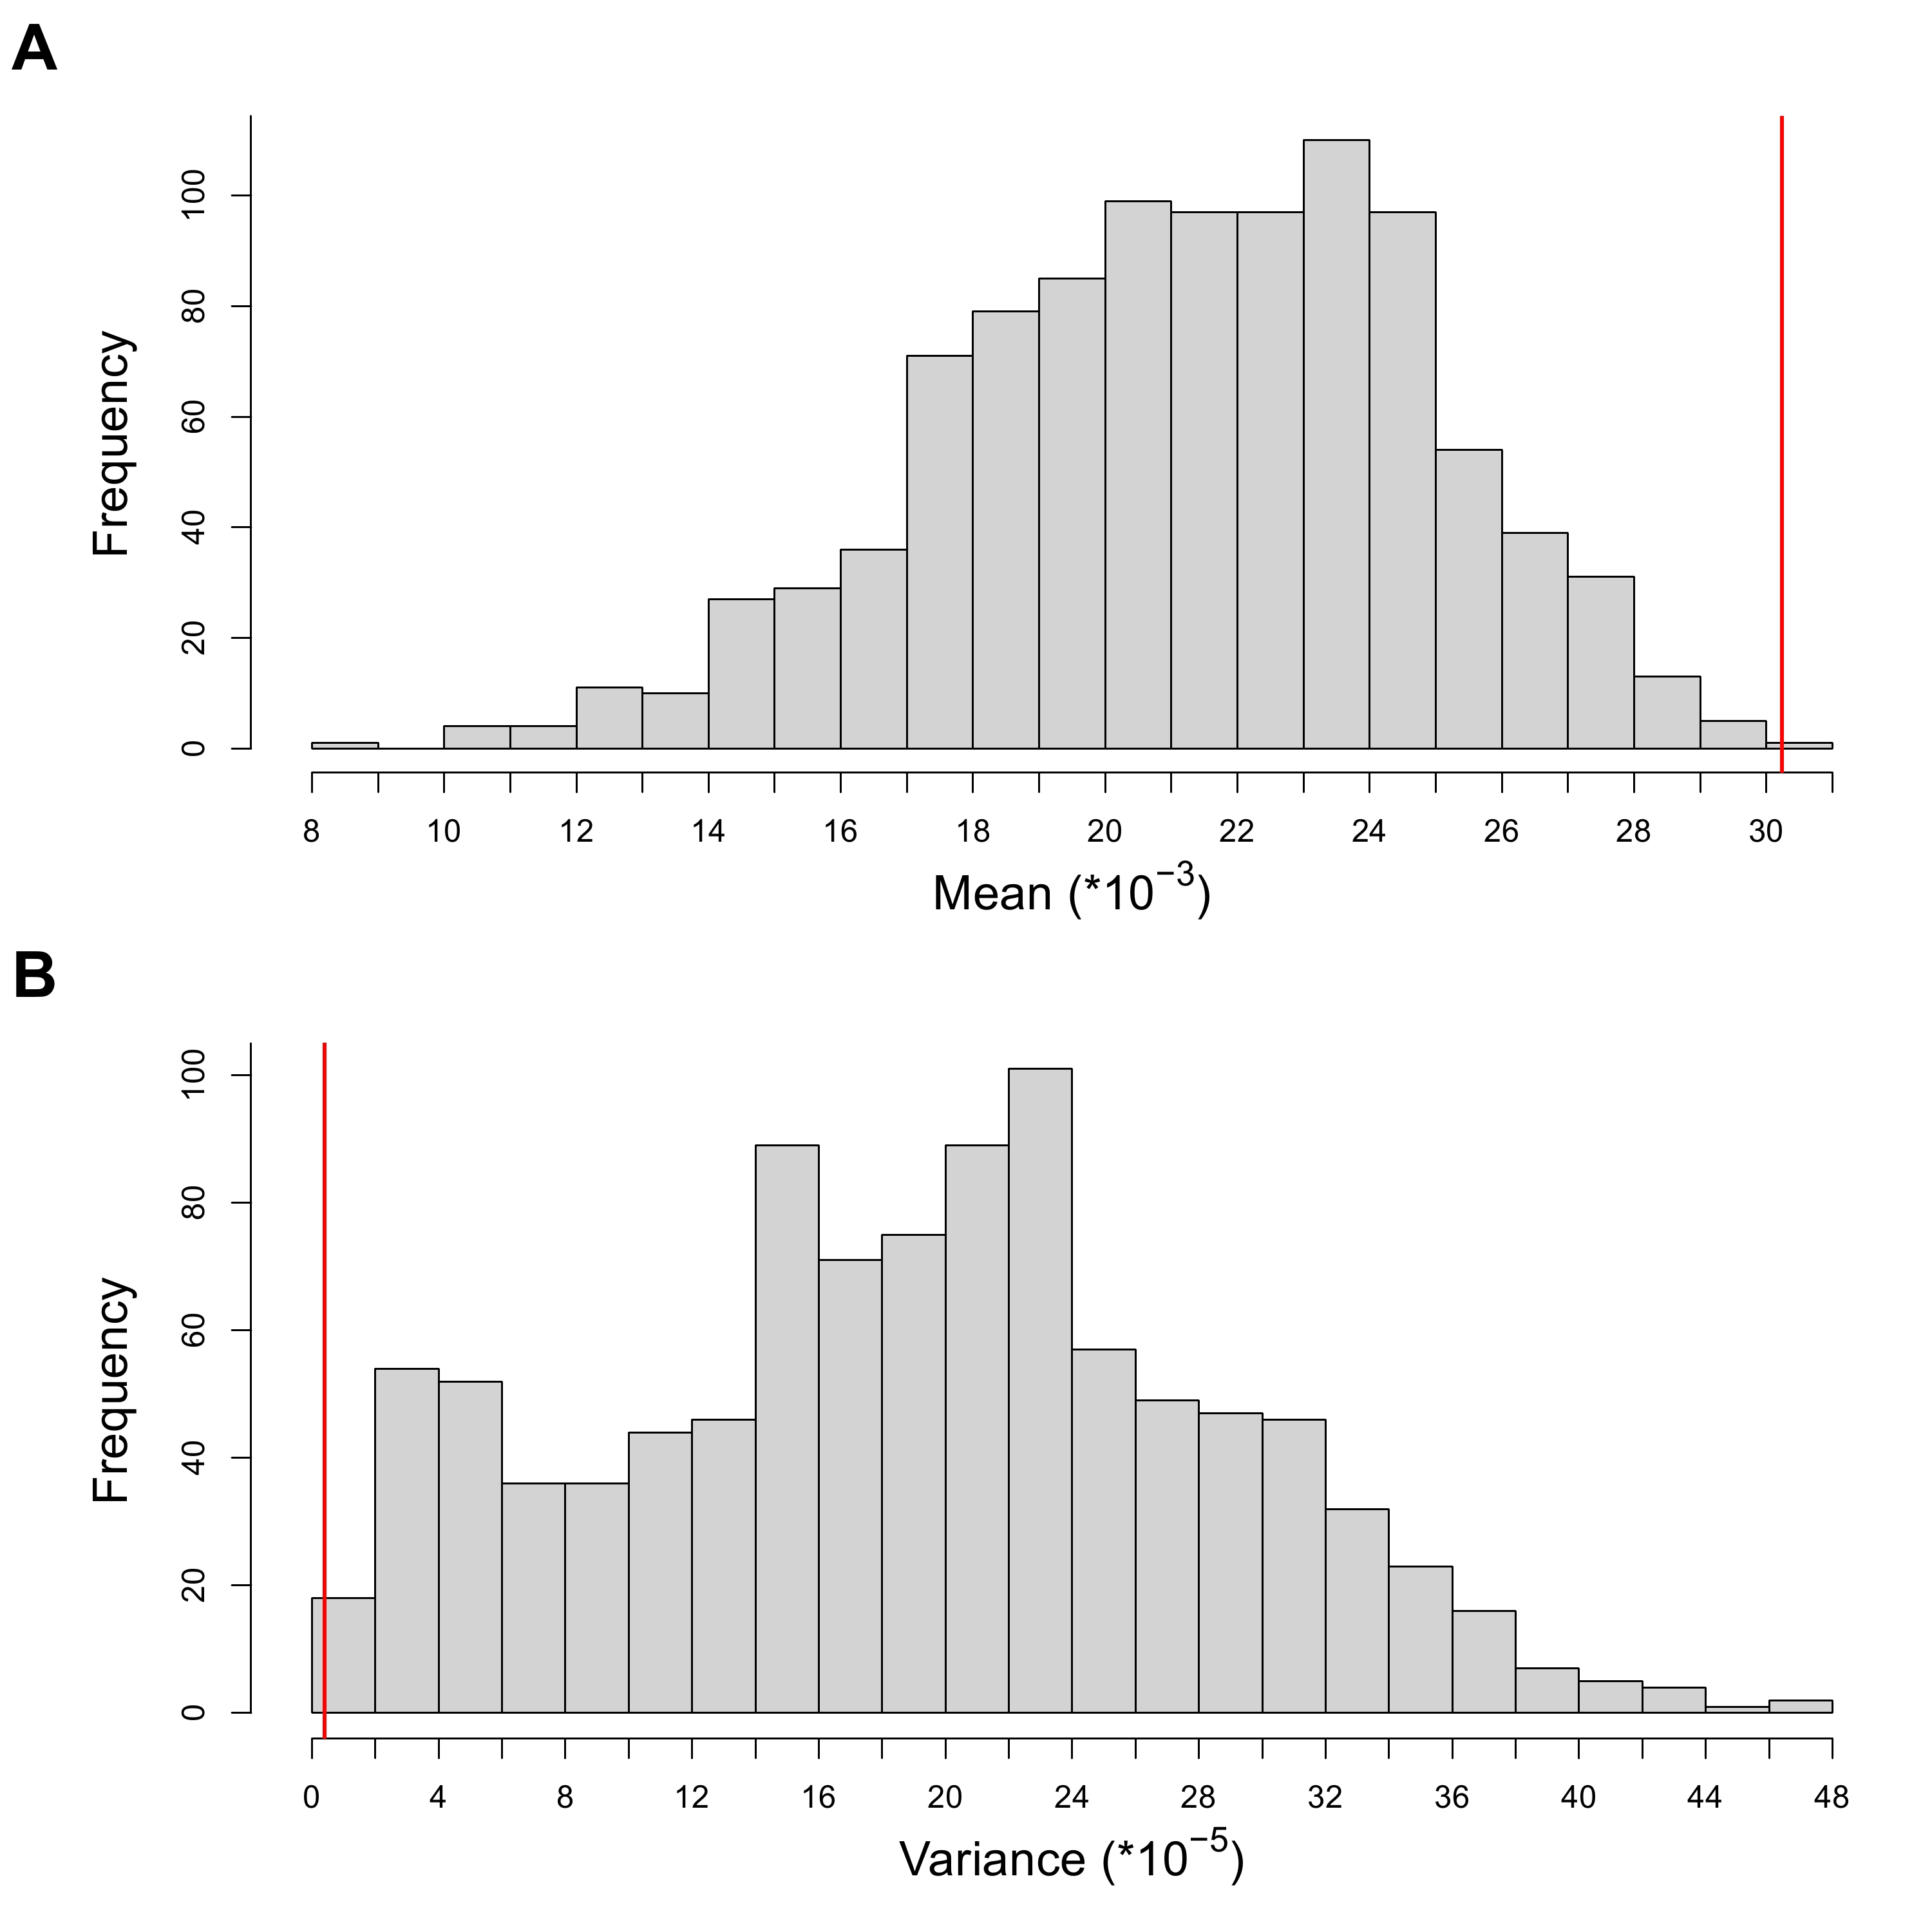
While a previous large-scale study reported no correlation between the ancestry profile and geographic location of ancient individuals across Mongolia and neighboring regions [3], GD and TK individuals seem to be more homogenous in their genetic profiles (summarized by their PC1 coordinates) and higher affinity toward the eastern Eurasian gene pool than ancient individuals across Mongolia matched to the time period. We quantitatively tested this tendency by comparing the mean and variance of the PC1 coordinates of GD and TK individuals to those of ancient individuals randomly sampled from available ones across Mongolia while matching the time period composition. Specifically, we created 1,000 sets of nine ancient individuals composed of one Xiongnu-Xianbei, two Turkic, one Uyghur, one Khitan, and four Mongol-period individuals [3,4,6,11]. None of the 1,000 sets have higher mean PC1 value nor lower PC1 variance than the GD and TK individuals, providing significant support for the eastern Eurasian affinity and genetic homogeneity within this region (empirical p-value = 0.001 for both; Figure 3). These patterns seem to hold for each time period although the number of individuals per period is fairly small. First, the Xiongnu-Xianbei period individual (GD1-4), the earliest among the GD individuals, clusters together with the published Rouran-period individual from Mongolia [12]. Second, four GD individuals belonging to Turkic/Uyghur/Zubu periods on average show a much higher genetic affinity to the eastern Eurasian gene pool than those from central Mongolia when we applied the same random sampling approach used for the total set of GD and TK individuals (empirical p-value = 0.038; 37 out of 1,000 random sets with the mean PC1 value higher than that of the four GD individuals; Figure S9) [3,4,11]. Third, the Mongol-period TK individuals form a tight cluster within a more diffused distribution of published Mongol-period individuals [3]. This limited distribution of TK individuals is pronounced both in PC1 and PC2 axes when we applied the same random sampling approach (empirical p-value for PC1 = 0.005, 4 out of 1,000 random sets show lower variance than TK individuals; empirical p-value for PC2 = 0.002, 1 out of 1,000 random sets show lower variance than TK individuals; Figure S10) [3,6].
3.3 Modeling the ancestry profile of the GD/TK individuals
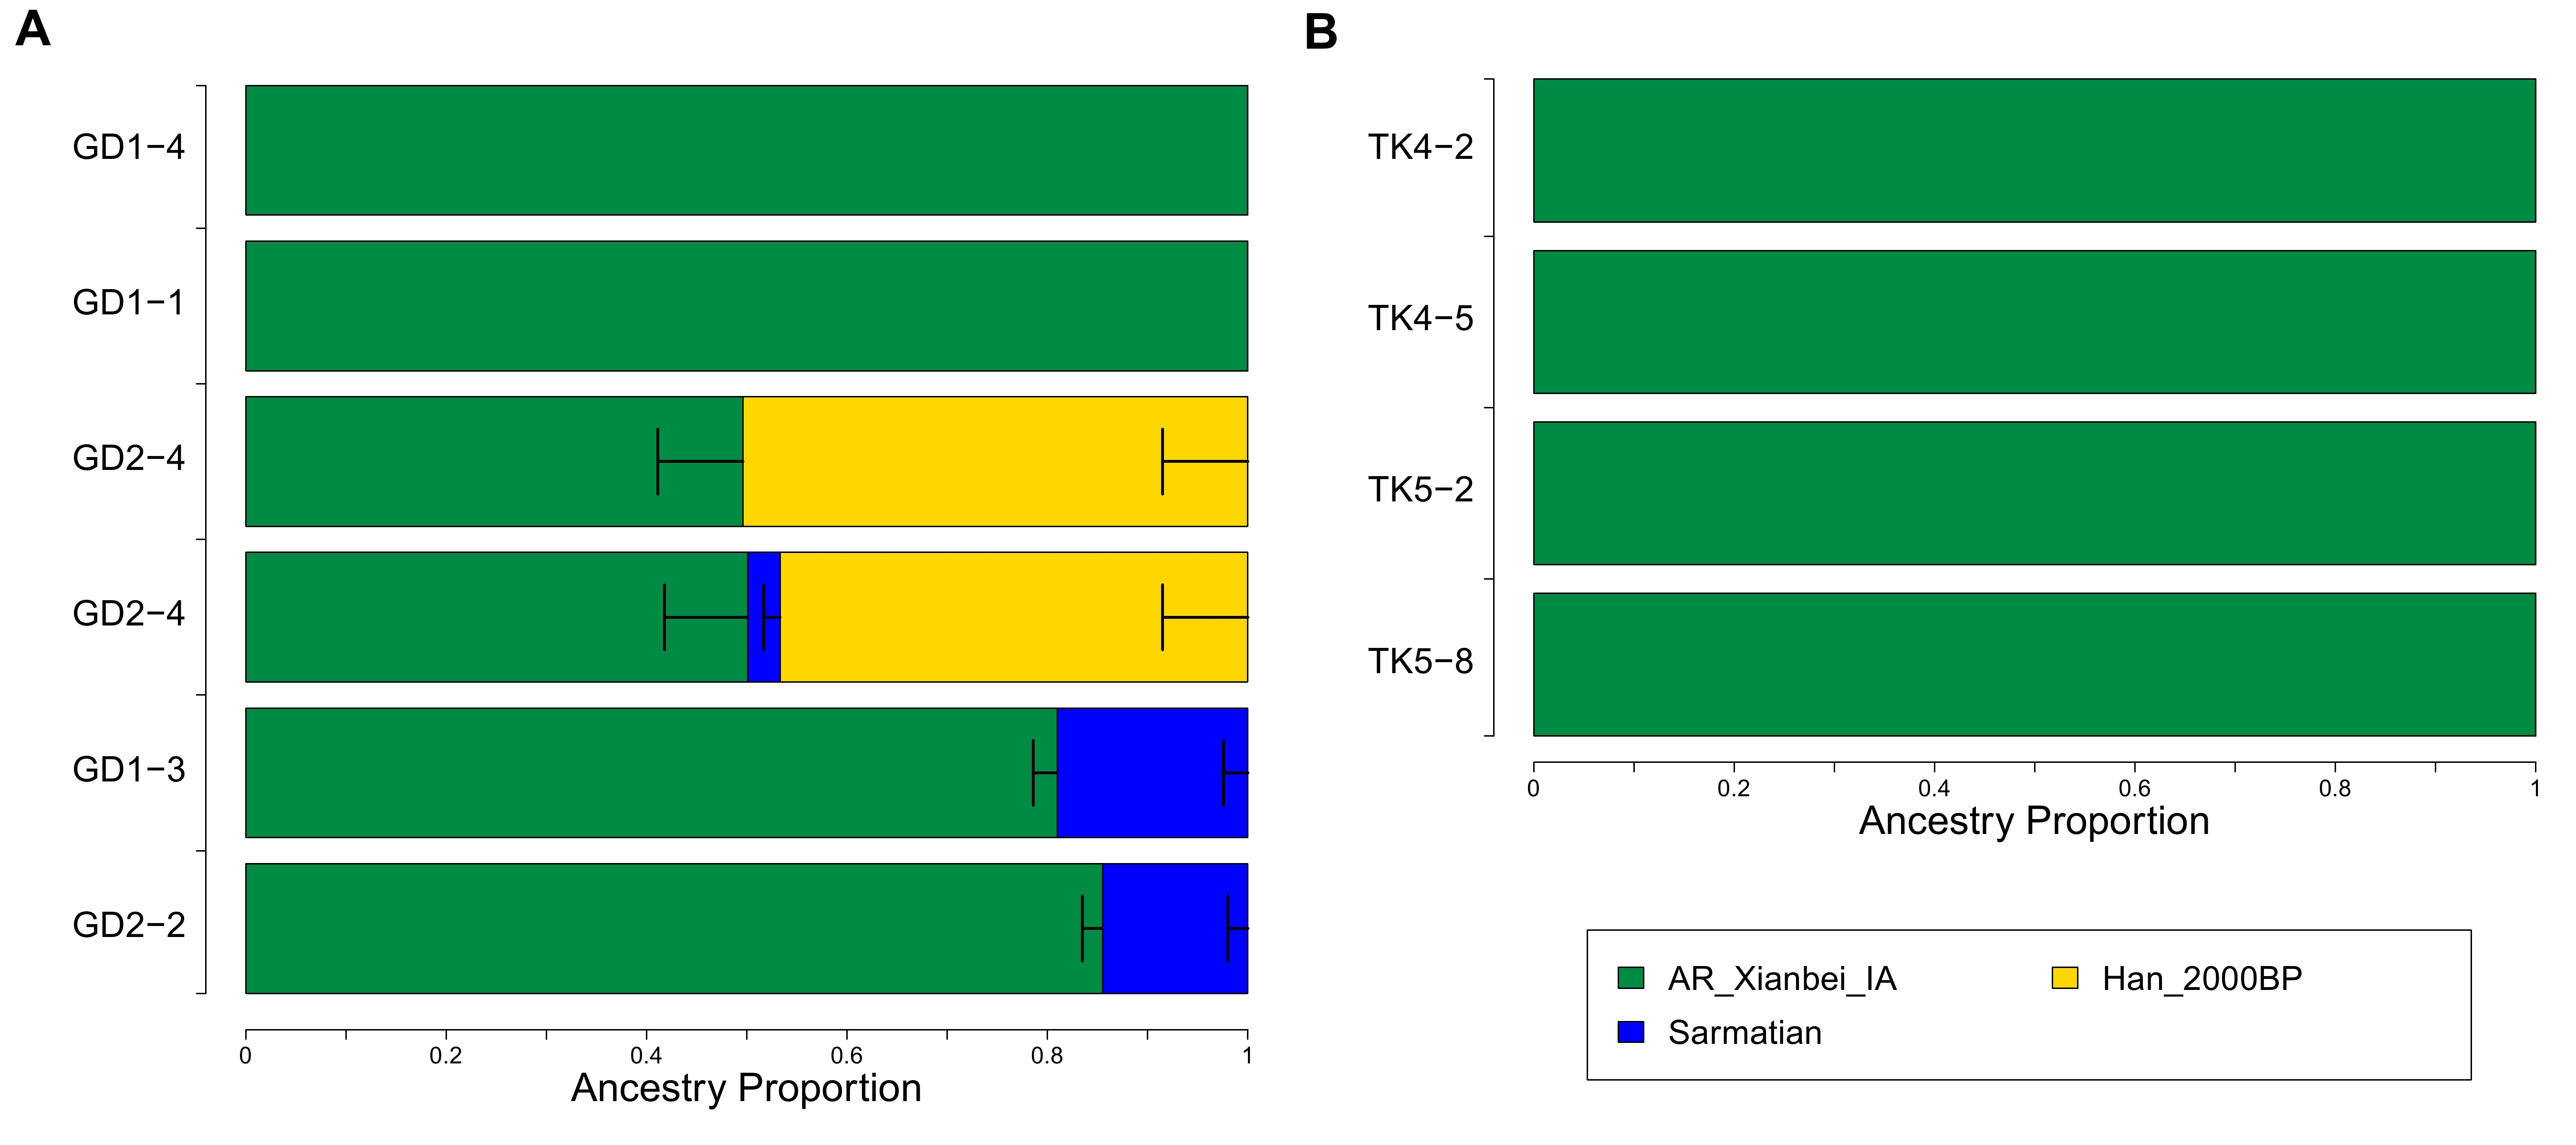
We grouped GD/TK individuals into five groups, GD_Xiongnu-Xianbei (GD1-4), GD_Turk (GD1-1 and GD2-4), GD_Uyghur (GD1-3), GD_Zubu (GD2-2) and TK_Mongol (TK4-2, TK4-5, TK5-2, and TK5-8), based on their time periods and computed outgroup-f3 statistics of the form f3(Mbuti; GD/TK, X) (Figure S4 and Table S5) [24]. All five groups share highest genetic similarity with ANA populations. Then, we conducted qpAdm analysis to explicitly model the genetic profile of the GD/TK individuals (Figure 4) [23]. Based on the intuition given by PCA and outgroup-f3 results and previous research [3], we modeled individuals as a two-way mixture of ANA and a western Eurasian ancestry source. For the ANA-related source, we used Iron Age individuals from Mongolia associated with the Slab Grave culture (“SlabGrave1”; n = 13) [3,4] and the Xianbei-period individuals from the Mogushan archaeological site in the Amur River basin (“AR_Xianbei_IA”; n=3) [11]. For the western Eurasian source, we used Iron Age individuals from the Chandman archaeological site in the Altai belonging to the Uyuk culture (“Chandman_IA”; n=9) [3], Sarmatian-period individuals from the western/central Eurasian Steppe (“Sarmatian”; n=17) [5,30–32], and the Alans from early Medieval northern Caucasus (“Alan”; n=5) [5]. All three western Eurasian sources work equally well without qualitative difference (Table S6). Among the two eastern Eurasian sources, AR_Xianbei_IA is found to be a better proxy than SlabGrave1. Specifically, SlabGrave1 fails to model the eastern Eurasian ancestry in the GD/TK individuals when the Late Bronze Age population from northern Mongolia (“Khovsgol_LBA”) [3,29] is included in the set of reference populations to increase the resolution (qpAdm p-value ≦ 8.06 × 10⁻⁴ for all but TK5-8; Table S6). In contrast, AR_Xianbei_IA provides adequate two-way admixture models for eight out of nine GD/TK individuals except for a Turkic-period individual GD2-4 (qpAdm p-value ≧ 0.126 for all but GD2-4; Table S6). Six of them, including all four TK individuals as well as GD1-1 and GD1-4, in fact can be modeled as 100% AR_Xianbei_IA with no contribution from the western Eurasian source (qpWave p-value = 0.067 to 0.254; Table S6). The remaining two require 17–27% (±2–3%) (GD1-3; Uyghur period) and 14–20% (±2–3%) (GD2-2; Zubu period) western Eurasian ancestry, respectively (Table S6).
The Turkic period individual GD2-4 shows a substantial downward displacement along PC2 suggesting a genetic affinity toward East Asian populations who lived further to the south of Mongolia (Figure 2). Adding Han_2000BP, two Han period individuals from a mass grave site in the Omnogobi Aimag who were probably garrison soldiers of the Han Empire [3,5], as the third source, we obtain fitting models to GD2−4 with all three western Eurasian sources (qpAdm p=0.616−648; 48−50 ± 8% from AR_Xianbei_IA, 3−5 ± 2% from western Eurasian, 47 ± 8−9% from Han_2000BP; Table S6). We confirm that the western Eurasian ancestry proportion of GD2-4 is negligible, as expected from the small estimate of 3% with the 95% confidence interval including zero, by showing that a simpler two-way admixture model excluding the western Eurasian source also fit GD2-4 (qpAdm p=0.424; 50 ± 8% from AR_Xianbei_IA and 50 ± 8% from Han_2000BP; Table S6). There are multiple cases of previously published Xiongnu and Turkic period individuals who harbor this combination of ancestry components [3].
4. Discussion
In this study, we reported nine individuals excavated from two cemeteries in eastern Mongolia, GD and TK. Although small in number, they form a local time transect that spans over a millennium from the Xiongnu-Xianbei to Mongol periods. The GD individuals especially cover Turkic, Uyghur, and Zubu periods for which ancient genomes have been only scarcely reported [3]. Our time transect, in combination with previously published large-scale sampling across Mongolia and neighboring regions [3,4,6], provides a rare chance to look into the dynamic spatiotemporal genetic structure of nomadic pastoralists in less sampled eastern Mongolia. Interestingly, the nine individuals from the GD and TK sites are overall higher in the eastern Eurasian ancestry proportion and less heterogeneous in their genetic composition than the matched random sets of ancient individuals across Mongolia. Their overall similar genetic profiles across a millennium in this small area is in contrast to high genetic heterogeneity and repeated genetic turnovers found in a regional scale across Mongolia [3]. Therefore, further sampling of ancient genomes from the GD and TK sites, as well as from nearby regions in eastern Mongolia, will help understand the mechanisms for the relative stability of the genetic profile in this region. In addition, similar future studies on the other regions peripheral to the eastern Eurasian steppe, such as Inner Mongolia, the Altai, and the southern Siberian forest-steppe zone, may yield other region-specific patterns in the change of the genetic profiles during the Medieval period.
Among the nine newly reported individuals, the Xiongnu-Xianbei period individual (GD1-4), a Turkic-period one (GD1-1), and all four Mongol period TK individuals are cladal with AR_Xianbei_IA (Table S6). The other Turkic period individual (GD2-4) is also modeled without a western Eurasian ancestry component. Even the remaining two individuals, one Uyghur and one Zubu period, have a western Eurasian ancestry component ranging 14–27%. The limited genetic heterogeneity of the Medieval GD individuals are in sharp contrast to previously reported Medieval individuals from central Mongolia [3], providing a new piece of information on this understudied period. For example, 22 early Medieval individuals published in a previous study (9 Turkic- and 13 Uyghur-period individuals) were modeled to have 0–100% eastern Eurasian ancestry (mean=50%, standard deviation=37%) [3]. We acknowledge that the interpretation of this difference is open due to small sample size as well as uncertainty and/or difference in the sociopolitical and economic status among the studied individuals. Therefore, our study highlights the need for further archaeogenetic works in Mongolia especially focusing on understudied Medieval period between the Xiongnu and Mongol empires.
While only a small number of Medieval individuals are available, it is still evident that the complex demographic history of the Medieval period cannot be fully elucidated solely by understanding the admixture history of the proceeding Xiongnu or succeeding Mongol period. In this study, newly reported individuals show an exceptionally low level of genetic heterogeneity, suggesting the presence of region-specific features unique to this era. Also, these individuals are better modeled with AR_Xianbei_IA than with SlabGrave1 as their eastern Eurasian source, requesting further investigation on the genetic heterogeneity of the early ANA populations in the region and the genetic identity and potential influence of Xianbei in the genetic profiles of ancient people in Mongolia [3,11]. We suggest future archaeogenetic studies in Mongolia to give more attention to the Medieval period to fill in the gap of our knowledge on this dynamic formative period between the two most-known empires in the Steppe, the Xiongnu and the Mongol.
Supplementary Materials
The following supplementary materials can be downloaded at: HPGG2404010004SupplementaryMaterials.zip
Figure S1. The post-mortem chemical damage pattern of GD and TK individuals.
Figure S2. The ratio of the coverage of sex chromosomes to the autosomes.
Figure S3. Genetic relatives detected within GD and TK sites.
Figure S4. Outgroup-f3 statistics of GD and TK groups.
Figure S5. HapROH results for GD/TK individuals.
Figure S6. The genetic profiles of the 6 source populations for GD/TK individuals along the two Eurasian PCs.
Figure S7. ADMIXTURE cross-validation error analysis for K (K=2-10) with ten replicates.
Figure S8. ADMIXTURE results for 1,774 present-day Eurasian and 207 ancient individuals for K=2 to K=10.
Figure S9. The distribution of the mean values of PC1s of four randomly sampled individuals with identical time period composition to GD.
Figure S10. Low heterogeneity of the genetic profiles of the four Mongol-period TK individuals.
Table S1. Summary of GD and TK individuals analyzed in this study.
Table S2. The published populations used for the population genetic analysis.
Table S3. Genetic relatives in this study.
Table S4. Summary of uniparental haplogroups of the previously published ancient individuals during Xiongnu to Mongol period.
Table S5. Populataion-based outgroup f3 results of GD and TK populations.
Table S6. QpAdm modeling of GD and TK individuals.
Declarations
Ethics Statement
Not applicable.
Consent for Publication
Not applicable.
Availability of Data and Material
All newly generated sequencing data reported in this study, including raw reads (FASTQ) and aligned reads (BAM), are available from the European Nucleotide Archive under the accession number PRJEB72297. The genotype data of newly analyzed ancient individuals for the 1240K panel have been deposited in the Edmond Data Repository of the Max Planck Society (https://edmond.mpg.de/dataset.xhtml?persistentId=doi:10.17617/3.DDZCWN). All analyses are performed using publicly available programs and the specific names and versions of the programs and non-default options are described in detail in the Methods section.
Funding
This work was supported by National Research Foundation of Korea (NRF) grant funded by the Korea government (MSIT) RS-2023-00212640 (C.J.); Japan Society for the Promotion of Science KAKENHI Grant (No. 17H00938 to N.S.; No. 21H04358 and No. 20H05822 to T.G.); and SAKIGAKE Project in Kanazawa University (T.G.).
Competing Interests
The authors have declared that no competing interests exist.
Author Contributions
N.S., C.J., and T.G supervised the study. T.A., B.T., T. M., and T.G. provided bone samples and assembled archaeological and anthropological information. T.G. performed ancient DNA analysis in the laboratory clean room in Kanazawa University. T.S., A.T., and T.G. generated genomic data from MiSeq and HiSeq in Kanazawa University. T.S., and T.G. carried out preliminary analysis of genomic data for screening ancient human remains and exploring the genetic affinities between ancient individuals and modern human populations. S.N., and T.G. coordinated collaborations to enhance research content. J.L., T.S., S.N., C.J., T.G. performed in depth population genetic analysis. J.L., C.J., T.G. wrote the manuscript with the input from all co-authors.
Acknowledgement
We thank T. Adachi, N. Kawai and S. Nakamura (Kanazawa University) for providing the laboratory and other facilities used in this study. We appreciate the appropriate support provided by S. Itoh, H. Yamagata, and K. Nakamura (Paleo Labo Co., Ltd.) in the radiocarbon dating of human remains. We acknowledge Kanazawa University for MiSeq and HiSeq sequencing.


 ,
Takehiro Sato
2
,
Takehiro Sato
2