
Human Population Genetics and Genomics ISSN 2770-5005
Human Population Genetics and Genomics 2024;4(4):0011 | https://doi.org/10.47248/hpgg2404040011
Perspective Open Access
The 30th anniversary of “The History and Geography of Human Genes”
Paolo Menozzi
1,2
 ,
Alberto Piazza
1,2,†
,
Alberto Piazza
1,2,†
Correspondence: Paolo Menozzi
Academic Editor(s): Lounès Chikhi
Received: Oct 6, 2024 | Accepted: Nov 11, 2024 | Published: Nov 17, 2024
This article belongs to the Special Issue Luca Cavalli-Sforza’s legacy, 100 years after his birth
© 2024 by the author(s). This is an Open Access article distributed under the terms of the Creative Commons License Attribution 4.0 International (CC BY 4.0), which permits unrestricted use, distribution, and reproduction in any medium or format, provided the original work is correctly credited.
Cite this article: Menozzi P, Piazza A. The 30th anniversary of “The History and Geography of Human Genes”. Hum Popul Genet Genom 2024; 4(4):0011. https://doi.org/10.47248/hpgg2404040011
On the occasion of the 30th anniversary of the publication of “The History and Geography of Human Genes”, the story of its origin and motivation is revisited by looking at nearly two decades of work that the book required. By describing details of activities that now have been abandoned thanks to technological advances, we try to communicate the irreplaceable importance of the motivational bases of research. We then look at the remarkable 30 years of the book’s life from its diffusion to the stability and longevity of its citation history, along with its inspirational impact on the scientific inquiries in many different fields.
Keywordsanniversary, History and Geography of Human Genes, gene frequency maps, multidisciplinary research
We are grateful to G. Barbujani and L. Chikhi for suggesting that we revisit the experience of producing our book, “History and Geography of Human Genes” (HGHG) on the 30th anniversary of its publication. Luca Cavalli Sforza died 8 years ago and to my painful distress, Alberto Piazza passed away after we had begun working on this paper. So, I am the only living author.
Alberto and I exchanged messages on how to organize this paper. We were aware that the special issue of “Human Population Genetics and Genomics” (HPGG) dedicated to the centenary of Luca Cavalli-Sforza’s birth [1] provided an updated, deep, solid assessment of each field touched by his multidisciplinary research activity. With the context of Luca’s work so well covered, we thought our paper on the HGHG anniversary could be framed on a fact-based evaluation of the impact of the book using citation data in time (Figure 1). Recently highly refined scientometric analyses have been produced. A good example is the Carlson and Harris paper [2] on the 50th anniversary of Lewontin’s 1972 article, iconic for its observation that the vast majority of genetic differences between humans were found within, not between, populations. For a multifaceted work like HGHG, we thought a simpler evaluation of citations in time (Figure 1) and an estimate of their proportions by disciplinary origin would provide a more easily understood estimate of the book’s cultural impact (Figure 2).
We also realized that providing information on the long years of work (1978-1994) required to organize the book’s contents and to decide how to display them would add context to the story. A contemporary reader has grown accustomed to the continuous exponential growth in computer speed and information processing availability (even on a smart phone). It is probably difficult to realize that the very same exponential growth, in the 16 years of work put into the book, meant a striking increase in computer speed and in the availability of computer information processing. We hope that our narration will give a feeling for how different the intellectual tools and the procedures of the 1980s were from current ones, how much they changed during the 16 years of our work and how a flexible attitude was needed for operating in such different conditions.
The idea of the book emerged from the interest generated by our Science 1978 paper [3] that made the cover of Science: using variables that synthesized the information from the geographic distribution of many allelic frequencies, we reported evidence of the genetic trace left in modern populations by the diffusion of farmers from the near east to Europe in the Neolithic. Currently, the paper continues to be cited as an early example of the use of multivariate statistical methods to analyze genetic relationships among populations.
Luca was in the process of publishing books in the prestigious Princeton Population Biology Series. He came back from a meeting with the publisher in which he had described the results of the paper submitted to Science, with the suggestion of extending the study to other regions of the world for a book in the series. We would construct synthetic genetic maps for each region and for the whole world. The genetic maps would then be used to search for potential historical, cultural or environmental explanatory correlates that would possibly be fitted into a coherent genetic history of the world.
It is amazing, looking back on that moment, how we committed ourselves unreservedly to an incredibly ambitious project that would require an amount of work potentially without limits. Certainly, there was an initial underestimate: in a note added in galleys to the Science paper after we agreed to the book, for further details on source of data and methods, we referred to the upcoming book as “in preparation”. The book was published 16 years later!
There was no special planning for the new project: we all saw it as an extension of the work that had led to the Science paper. I do not remember any mention of the need for a larger team given the project’s inestimably larger size. We did not set time limits for the different parts of the book: we had silently committed ourselves to produce a work with no shortcomings, with all potential criticisms preemptively answered: that is, a “perfect” product, although the word was never pronounced. We never openly mentioned it, but I think we were all aware that these premises had led historically to the many overly ambitious enterprises that in Italy can be found unfinished in many different kind of human activities.
We were aware of the strength of our team. A posteriori it is relatively easy for me to see what made the team so resilient. We each were at a very different point in our professional lives. Luca was an internationally established human population geneticist in his fifties, who had made major contributions to different research fields. (Two decades earlier he had studied recombination in bacteria collaborating with Joshua Lederberg who received a Nobel prize for his work on the topic). A full professor at Stanford, he had left Italy after the post 1968 turmoil in Italian Academia. Alberto with a degree in Physics, was well established internationally for his work on HLA immunological markers and his phylogenetic studies with Luca. For me, the Science paper was my first professional achievement. Luca had held a chair in Italy (in Genetics) through the 1960s. Alberto and I had our base in the Italian University system.
In the 1970s, Italian Academia was still recovering from the long-term effects of the deeply depressed economic and cultural status of the country. At unification in 1860, almost 80% of the population was illiterate and in 1931 the percentage was still 38%. A few facts: in 1938 there were only approximately 1200 University professors in Italy (all disciplines included). No chair in Genetics existed. In the same 1938, the devastating racial laws were introduced by the Fascist regime. Only in 1980, a third level of education was institutionalized nationally (i.e., a Ph.D. degree), but courses were not to be offered every year. In the 1970s, with a few exceptions, the Italian system ignored peer review. Hiring was mostly carried out with only formal comparative evaluations. Funding was scarce and delivered mostly as institutional services (for example: free computer time and consumables, help of technicians, etc.). This last feature, as we will see, turned out to be an opportunity for the work on the book.
In different ways, each of us considered himself fortunate to be given the chance to be part of a more dynamic US Academic system that offered so many opportunities to do good research. We felt we had to show we could produce a “perfect” work.
At a deeper level we felt that our choice of pursuing research as a life-time job had to be honored. In the article “Luca as our father” [4] a conversation between Luca and his professor Ronald A. Fisher over the reason why people chose research as their job is reported. “Curiosity” said Luca, “Ambition” corrected Fisher. We usually associate curiosity with the whimsical attitude of inquisitive children. Luca did not like “light” conversation but was a gentle and patient conversationalist. He very rarely lost his temper. But I do remember a passionate defense of the need to protect children’s creativity from oppressive educational approaches that can destroy the innate curiosity of children. In a way, curiosity for Luca seemed quite close to Dante’s Ulysses’ existential drive for knowledge (“per seguir virtute e canoscenza”).
In different ways this existential drive was shared by the three of us. Alberto in our initial discussion of this paper’s contents, expressed his preference for leaving out personal memories. But I cannot forget my admiring memory of Alberto listening to music reading the score in front of him. He had the same deep thoroughness in his quietly passionate commitment to research.
I am known as a contentious person, a fact that has not made my life easier. But I believe that some things are more true than others and cannot be quiet about it.
Besides everything else, what allowed us to overcome the difficult moments we often faced was the friendship based on the deep respect we felt for each other. We did become friends working together. Sometimes we were sitting in the same room; in other moments, especially in the last third of the 16 years of our endeavor, we worked hundreds or thousands of miles apart.
A last anecdote on the commitment to communication among us.
When Luca asked me to switch to the work that eventually would lead to the Science 78 paper, I had been in Luca’s lab for 7 months working on historical demographic data that I carried over from Italy. At Luca’s suggestion, I had been working on the relationship of population growth rate and village size, under the supervision of Carlo Matessi, a first-class Italian evolution modelist and naturalist who at the time was working in Luca’s lab. The growth/size relationship was not detectable given the variability in our data and we were not producing any results, because we were completely focused on looking for the right statistical method.
I did not want to leave the demographic data (eventually the results were published in the prestigious Journal Ecology). In spite of my contentious nature, I felt too weak to defend the demography work but did not think of anything better to say than I thought the relationship between the spread of agriculture and the genetics of extant populations was unlikely. The next day I agreed to abandon the demographic project. When the Science paper was accepted (two years after my awkward remarks and after an incredible amount of work on the paper) Luca surprised me by bringing back my initial objection to the project. He clearly cared for the opinion of the most junior member of the team. Sharing the project meant being fully committed to it. He always introduced Alberto and me as friends not collaborators.
I learned that, among real friends, words that speak the truth are very important for building solid human relationships.
Our team had chances for growth by sharing extra-work life moments. In the years spent in Stanford, we belonged by default to the local Italian enclave. Starting in 1980, the Italian academic world, regulated by law, was being rapidly reformed and often required physical presence in situ to guarantee access to academic positions. Soon Alberto and I only had summer months for work at Stanford. This opened the opportunity for within Italy mobility. For instance, I fondly remember the 2–3 days per week spent working on the evaluation of interpolation methods in the winter-spring of 1980 in Turin, where Alberto had free access to a fast computer. We walked together to and from the University and then at dinner he and his family shared his very interesting friends.
In the late 80s, as we will see later, the work was mostly being carried out at our home institutions. The three of us did have long days of intense exchanges, mostly at Luca’s home in Milan, during his visits to Italy. But also in Parma, going over stacks of maps and the related spatial statistics, enjoying simple meals of focaccia and prosciutto that Luca favored over the available elaborate dishes of the local cuisine.
In the Science paper, data were in good part from the Mourant et al. collection published in 1976 [5] that only required the addition of geographic coordinates for each data point. For the book, an update of population gene frequency data was seen as an obviously necessary step. Looking for publications that quoted the whole collection (or authors whose work was part of the collection) seemed an approach that would find most of the relevant work published after 1976. The Stanford Medical School library had the printed version of the early years of “Citation Index” that did exactly what we intended to do. Similar tools can now be easily found on the web. The volumes of the printed version needed a several meter long bench: they came in two sets of volumes organized in alphabetical order by author. One set was for the authors of the quoted papers and reported the list of quoting articles and one set of volumes was for the authors of the quoting papers and the papers’ references. For a search you had to walk from one set of volumes to the other. I found it thrilling to be using such a new research tool. In fact, the availability of its very early version was linked to the collaboration between the organizer of the Citation Index (E. Garfield) and J. Lederberg, who was the chairman of the Stanford Genetics Department at the time.
Before finding the Citation index, I had experienced how exciting it was to have access to the whole of the library system, open until late in the evening and the week-ends. My Stanford card (with no photo on it) would let me into the stack in direct contact with the collections. Cubicles could be reserved if you had the need to keep material within your reach for an extended period of time. By the 1980s, the citation index was available on cd and then, later, on the web. Walking from one set of volumes to the other was a thing of the past.
At the peak of our data gathering, it was decided to have some support for data entry. Stanford was offering its students the opportunity to work in its research laboratories as paid support staff. I learned that students, beside the money, were doing it to improve their CV. The student who joined us was very professional and asked for a detailed description of the job and the job’s time schedule that I provided (the job was entering gene frequencies and coordinates in our data base from the xeroxed page of a paper with gene frequencies and geographic coordinates of clearly marked populations). I now had a new pressure: to provide enough data for entry! To my surprise when, after a few months, the student made a request for a letter of recommendation, I offered, in the Italian tradition, to have Luca, as the head of the lab, sign it. The student refused: “You know me. You please sign it”.
As mentioned before and, as we will see later, the production of the final version of the maps was delayed by the search for optimal computational and graphic procedures. This forced us to make two further updates of our data set. One was triggered by the update to 1982 of Mourant collection (Tills et al 1983) [6]. The overlap between our searches and the data in Tills et al. was good. Most of the new data had been published in a relatively short list of 12 journals (list in chapter 1.9 - page 24 of the book). A further final update was needed in 1986 before starting the final run of analytical work. We felt confident that by searching the 12 journals for the years 1982-1986, our database would be up to date.
A final consideration on our gene frequency data. In the 1990s, fewer and fewer reports based on the classical markers used in the book were published. Classical markers contained so much less information on genetic variability than DNA based traits that their study was considered hard to justify. On the other hand, for several years, the laboratories equipped to study DNA based variability were two few to generate a number of population level studies equivalent to the ones based on classical markers of the previous decades. This contributed to the book’s longevity as a reference point for the field, as we will see later looking at citations.
The description of the methods used takes more than 150 of the book’s initial pages. To give a feeling for the work, I will focus on data analyses that required much more time and effort than classical aspects of a genetic analysis: map building and graphic display of contour maps and related statistics.
In the Science paper the interpolation procedure we used for obtaining a geographically regular grid of gene frequency values identical for all markers was defined “relatively simple”. The following quote is taken from the definition given in the Science paper (journal known for its brevity requirements). “The variable to be mapped (gene frequency) was interpolated at the nodes of a regular rectangular grid, generated by a Mercator projection. The interpolation followed a mixed strategy. The information available for each grid node within a circle of given radius around the node to be interpolated was first evaluated by counting the number of data points available in the circle. The radius of the circle was computed by a simple formula and varied from 7 to 17 minutes in great circle distance. If there were at least four data points available within the circle in each of at least three quadrants of the circle, then the strategy of interpolation was to fit a second-degree surface to the data within the circle, weighting each point within the circle by its sample size and by the square function of the distance between the data point and the grid node being interpolated. If the information available was less than the above, then a weighted average of the data available in the circle was used, with weights as above.”
In reality its complexity is obvious and it can help to understand why here we limit the description of the effort dedicated to interpolation in the preparation of the book to general principles.
Interpolation is essential to map construction. To draw a contour-map of values of a variable (in our case gene frequencies) from irregularly spaced sampling points we needed to estimate (interpolate) values on the nodes of a regularly spaced grid using the observed values of neighboring sampling points. It is a way of constructing new data points from known data points, in a scientific context, a task intrinsically exposed to objections. In our case, interpolated data were also necessary for computing multivariate statistics (we have referred to them as synthetic variables) when gene frequencies were not available in all locations for all markers. For gene frequencies additional complications had to be considered: the accepted evolutionary generating process had one random component (drift), the sampled locations (populations) were not randomly distributed in space (as in a planned investigation) but determined by heterogeneous causes of availability (control samples in other studies, blood donors, anthropological investigation to name a few).
We were trying throughout the book to preempt criticism. It is not surprising that a lot of energy and time were needed to find a sound interpolation method.
Interpolation can be carried out by using only neighboring values or by also considering the spatial covariance of the complete data set available.
Spatial Statistics is a branch of statistics that studies patterns and correlation in spatially observed processes. These often play a key role in solving important practical issues in many different fields. John Snow’s 1854 co-mapping of water fountains and number of cholera deaths to identify the source of a cholera outbreak in London is often mentioned as an early example of applied use of spatial statistics.
The important applied nature of spatial statistics is the likely cause of the use of different parameters with different names often defining a similar feature in the data. For instance, the definition of neighborhood size in geo-statistics applied to the oil industry might be used for choosing the location of the next test drilling site (a very expensive decision). In geo-statistics, the neighborhood size is the distance at which the variogram (the function of variance with distance) flattens out. In economics and in biology, the flattening of correlogram (the function of covariance with distance) is used.
We extensively tested different approaches by jack-knifing and found that a modification of the Science approach was slightly better than more global approaches [7].
In those years the geographic approach to evolutionary studies was developing at great speed as witnessed by the new terms used over time to refer to it in general methodological terms (Geographic Information System) or in specific situations (Phylogeography, Landscape genetics). We went on testing more new approaches but, in the end, what we incorporated in our interpolations was an “objective” way of choosing neighbors by using a Voronoi tessellation. Its construction is relatively simple. We start by joining each n pair of sampling points by a line. We then draw the perpendicular bisectors to each of these lines. These bisectors define a polygon with n sides. Points that share a side are neighbors to be used in the interpolation.
The interpolated values at the nodes of a geographically determined grid could have been used to draw by hand the band of equal gene frequency (or synthetic variable) of our maps.
Pursuing a completely computer driven graphic production was coherent with the “non subjective” approach we wanted to use for the book. There was also a practical reason. We had decided to enrich each map with a spatial statistical analysis computed for each sampling point of each map and for each set of data used in building each of the hundreds of maps we produced. To handle by hand the appropriate symbol used to represent the statistics for each data point seemed prohibitive.
Aesthetic reasons and the availability of professional level pen plotters at the University of Parma encouraged the choice of tools that we knew were intrinsically more complex and time consuming than the video screens that, for instance, we used for color maps.
For each map we produced two sheets: one with the shadings of the different gene frequency values and a second one with the statistics for each data point and for the mapped data set.
The final computer code (that we had developed in FORTRAN) had more than 10000 lines. The statistical part had been developed over time with Alberto, the graphic routines were prepared in Parma.
Here we can see a remarkable plus of the old Italian university system. I was allowed to ask for the help of Enzo Siri, an incredibly gifted department computer programmer. Luca had taught a course in Parma in the 60s and had convinced the University to buy an Olivetti prototype computer that had to be programmed moving wires on a matrix of physical slots. The computer would work 0-24 and Enzo, hired as a low paid technician (but with a life-long appointment) had volunteered for the job. He proudly talked about the cot they had used for resting while the incredibly slow computer was carrying out the computations. He was culturally a descendant of the Genovese sailors that had a “right to rumbling out complaints”.
Our job was challenging: FORTRAN had not been built for graphic work. In the late 80s it was already an old language and was being tentatively updated. I remember the introduction of a routine to handle a random access to disk file contents, a needed feature when computers had fairly limited RAM (random access memory). I talked Enzo into using the new feature for handling the coordinates of the coast-lines of our maps. He resisted but the next day he complained that the night before “the random-access disc file” had kept him awake because he could not stop working on it in his mind.
Computer time on an IBM machine, fast for the times, located in Bologna and accessed by phone line via a modem, was free. The Parma university computer facility provided for free the unlimited rolls of expensive plotter paper and ink cartridges that I was using.
In August 1991, a large yellow plastic Samsonite suitcase full of the original graphic work was shipped to Princeton: more than 1000 large sheets to be shrunk to the printed image size to improve quality. DHL suggested insurance. What’s the value of 16 years of work? If lost, copies would not be of print ready quality. I could only ask for a fax back to me confirming delivery. We got it!
It took three more years for the editorial work to be completed. I remember the first galleys received more than 3000 changes, some quite extensive.
As mentioned in the introduction, for the large number of other important topics touched on by the book (Cultural inheritance, Demographic history and population genetics, Demic diffusion, Migration diversification and admixture and genetic clines, Phylogenetic evolutionary methods, The human genome diversity project (HGDP), The history of human languages, Anthropology) we think that the special issue “Luca Cavalli-Sforza’s legacy, 100 years after his birth” published by HPGG provided an updated, authoritative assessment.
The book was given generous and positive coverage in a wide range of publications relevant to the many research fields it touched.
“The reconstruction of the human family tree--its branching order, its timing, and its geography--may be within our grasp. . . . This research has great importance for the obvious and most joyously legitimate parochial reason--our intense fascination with ourselves and the details of our history” Stephen Jay Gould, Natural History. “This is the most comprehensive treatment of human genetic variations available . . . An impressive display of synthesis and analysis” Science. “This long-awaited magnum opus is a major contribution to our knowledge of human genetic variation and its distribution on a global scale” American Scientist. “The book summarizes and integrates an extensive and diverse literature and there is no comparable work in existence today” Robert R. Sokal, Quarterly Review of Biology. “The enormous breadth of its conclusions and its global scope will make this an extremely important book in the whole field of the humanities and in the scientific study of human populations. The authors are pioneering in their mapping of gene frequency distributions and in their historical interpretations of that patterning” Colin Renfrew, Jesus College, University of Cambridge. “A crowning achievement, a compendium of a career’s work, and a sourcebook for years to come. . . . a landmark publication, a standard by which work in this field must be judged in the future” Kenneth Weiss, American Journal of Human Biology. This book represents a landmark in biology. There is nothing of its kind, in either zoology or botany, where the evolutionary history of a single species possessing a cosmopolitan distribution is distilled from genetic, morphological, and cultural data. It represents an essential historical source for all human biologists, guaranteeing its importance in evolutionary biology. It will, no doubt, also become an essential tool for researchers in linguistics, demography, and anthropology” Rebecca L. Cann, American Journal of Human Genetics.
Jared M Diamond’s review for Nature was the one that impressed me most: “In reading this book, I felt as I do when eating one of my wife’s raspberry chocolate nut layer cakes. Both the book and the cake are rich, dense, uniformly high in quality, heterogeneous in subject matter and best enjoyed by repeatedly removing it from the refrigerator or the bookshelf to take small bites.” As much as these words by a best-selling author, who is also member of both the American Academy of Arts and Sciences and member of the National Academy of Sciences would make anybody blush with pride, more precious for me was the rest of the review in which he illustrates how great science often “depends on a mixture of perspiration and inspiration”. As an example, he mentions a work by Alberto and Luca who used surnames frequencies of more than 10 million Italians obtained from telephone books (the perspiration) to estimate migration rates in Italy (the inspiration). Then he extended the example to the work reported in our book, summarizing the numbers (128 alleles, 1800 aboriginal populations reduced to 491 populations, 116 aggregate populations, 518 maps etc.) – (the perspiration) - and added that “the book was written to be an encyclopedia not only of world genetics but also of world archeology, geography, history, prehistory, linguistics and physical anthropology” (the inspiration). The review seems to me to have picked up the unlimited commitment to our endeavor that we described earlier in this paper.
The book won the 1994 R.R. Hawkins Award by the American Publishers Association, created in 1976 to recognize outstanding scholarly works in all disciplines of the arts and sciences.
In 2005 HGHG was included in A Century in Books: Princeton University Press 1905–2005 [8]. The volume highlights 100 of the nearly 8,000 published in the century 1905-2005 by the publishing house. “These books best typify what has been most lasting, most defining, and most distinctive about our publishing history—from Einstein’s The Meaning of Relativity (1922) to the numerous mathematical and other works that marked the Press’s watershed decade of the 1940s, including von Neumann and Morgenstern’s Theory of Games and Economic Behavior; from milestones of literary criticism by Erich Auerbach and Northop Frye to George Kennan’s Pulitzer Prize-winning book on Soviet-American relations; from Milton Friedman and Anna Jacobson Schwartz’s A Monetary History of the United States, 1867-1960 to more recent landmarks such as L. Luca Cavalli-Sforza, Paolo Menozzi, and Alberto Piazza’s The History and Geography of Human Genes and Robert Shiller’s Irrational Exuberance.”
The book reached many readers. Sales exceeded expectation especially for such a massive (1000 pages, 5 pounds) and expensive book. The hard cover version sold more than 10000 copies over the decade after publication. An abridged edition (without the more than 500 maps) offered in 1996 sold more than 11000 copies over the 12 years after publication.
Alberto organized the Italian translation. Based on the Princeton abridged version, it was published by the prestigious Italian publisher Adelphi in 1997. With more than 13000 copies sold it reached a very large number of readers in the Italian book market beyond the academic world.
As mentioned earlier, the special issue of HPGG dedicated to the centenary of Luca Cavalli-Sforza’s birth provides an updated, deep, solid assessment of Luca’s achievements by contemporary recognized authorities in the fields touched by his research activity.
Here we will focus on the impact of the book using citation data. Different platforms offer citation counts based on different sources. Web of Science counts are based on published, peer-reviewed contents. Google Scholar counts are based on a diverse and larger set of sources including published articles, preprints, theses, books, and web sites contents. We opted to use Web of Science counts that usually return a smaller number of citations but make it easier to attribute a citing work to a scientific field. We compared counts for our book in a few sample years and found that Web of Science returned about half the citations (all from peer-reviewed sources) found by Google Scholar (from more diverse sources).
The histogram of citations per year (Figure 1) shows a sustained number of citations, more than a hundred a year, that started to decrease only in the last decade for a total of more than 3000 citations. A total of more than 6000 according to Google Scholar.
Figure 2 shows the number of quotes per year by research area. Not surprisingly, quoting works belong to numerous and diverse research fields.

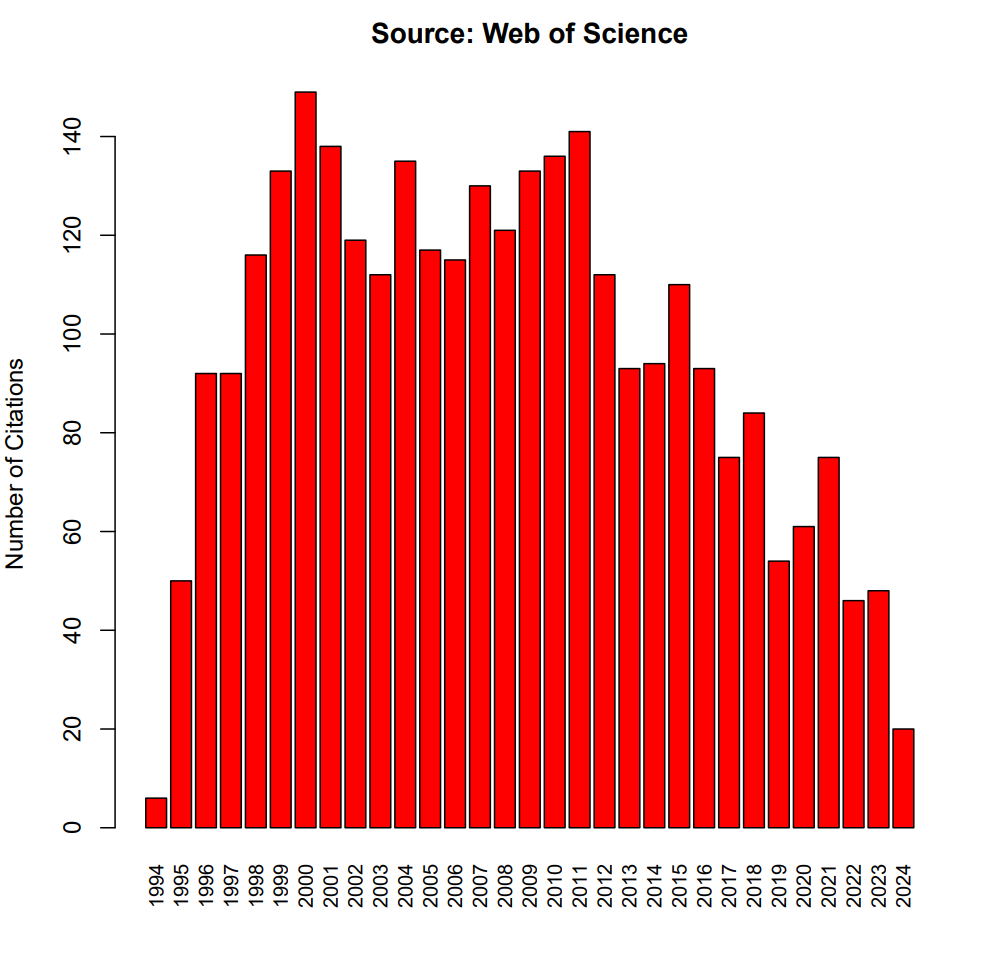
Figure 1 Number of citations in time. 2024 first 6 months.
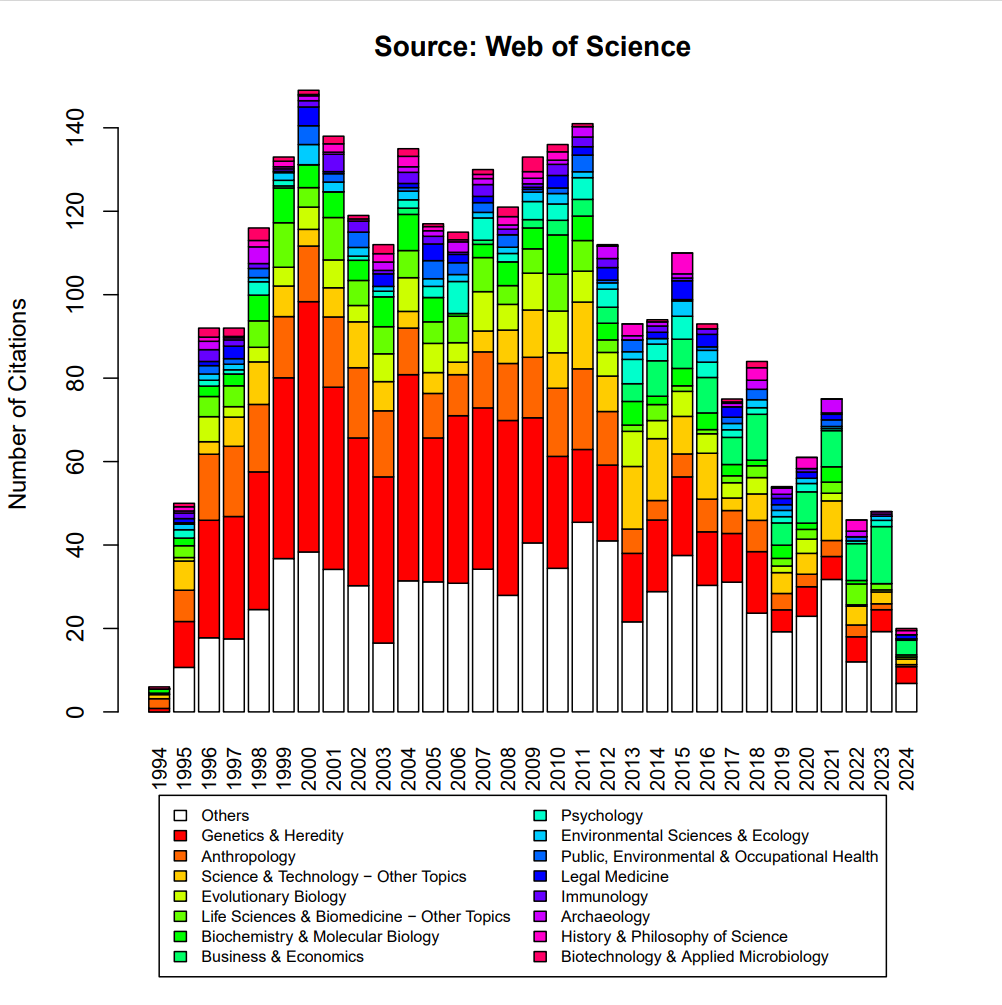
Figure 2 Number of citations in time by disciplinary origin.
Every day I receive information on the current interest in the book in the modern forms that have been developed by web platforms (like the “number of reads” of the platform ResearchGate) to quantify interest for sources that can be accessed online. It would be easy to get into the anecdotal narration of the experience, but it seems more interesting to conclude mentioning examples of the trace left by the book in recent research.
We mention in the introduction one of the papers celebrating the 50th anniversary of the Lewontin 72 article [2]. The Lewontin paper received quite a few quotations after publication in 1972, but their number slowly decreased to a small number in the 1990s, followed by a post 1994 sudden increase. The authors link the increase to Luca’s lab: “in 1994, Bowcock et al. [9] replicated Lewontin’s finding that most genetic variation exists within populations, using newly available polymorphic microsatellite data. The same year, Cavalli-Sforza et al. published their landmark book that was highly influential and cited Lewontin 1972”. It is relevant to mention that in 1994 The Bell Curve [10] had been published and race and intellectual abilities were a subject of intense debate. The Lewontin 72 paper was associated with the widely held consensus that race is a social construct, not a biological one. Our book brought in the weight of the very large size of its collected data and the clear illustration of the scientific evidence of the inapplicability of race as a criterion for classification of human beings. The Italian translation received the attention of the general press as an iconic antiracist intellectual tool.
The final example of the trace left by the book seems an effective way of closing our narration. David Reich, a leading authority on ancient DNA studies, in his introduction to his 2018 book Who We Are and How We Got Here [11] defines ours as “inspired by a visionary, Luca Cavalli-Sforza”. “The History and Geography of Human Genes was the high-water mark of his career. He was a pioneer in his early recognition of the full potential of genetics for revealing the human past, but his vision predated the technology need to fulfill it”.
The authors have declared that no competing interests exist.
My friend and former colleague Prof. Stefano Leonardi (University of Parma) ran the citation analysis on Web of Science and produced Figure 1 and Figure 2. Friends and former colleagues read and helped improve the manuscript. Special thanks to my wife Wallis Wilde-Menozzi, an American writer, who emotionally supported me throughout the months that took to write the paper. She also read the manuscript and made suggestions that improved the text without removing the Italian flavor of my English, the working language of our 44 years of marriage.
Many thanks to the reviewers for their helpful comments. Special thanks to Prof. Laurent Excoffier who signed his review and returned a carefully annotated manuscript.
| 1. | Chikhi L, Barbujani G. Luca Cavalli-Sforza, 100 years after his birth. Hum Popul Genet Genom. 2021;1(1):0001. [Google Scholar] [CrossRef] |
| 2. | Carlson J, Harris K. The apportionment of citations: a scientometric analysis of Lewontin 1972. Phil Trans R Soc. B.;2022(377):20200409. [Google Scholar] [CrossRef] |
| 3. | Menozzi P, Piazza A, Cavalli-Sforza LL. Synthetic Maps of Human Gene Frequencies in Europeans: These maps indicate that early farmers of the Near East spread to all of Europe in the Neolithic. Science. 1978;201(4358):786-792. [Google Scholar] [CrossRef] |
| 4. | Cavalli-Sforza M, Cavalli-Sforza F, Cavalli-Sforza L, Cavalli-Sforza V. LUCA, as our father. Hum Popul Genet Genom. 2021;1(1):0002. [Google Scholar] [CrossRef] |
| 5. | Mourant AE, Kopeć AC, Domaniewska-Sobczak K. The distribution of the Human Blood Groups and other Polymorphisms. Oxford, UK: Oxford University Press; 1976. [Google Scholar] |
| 6. | Tills D, Kopec AC, Tills RE. The Distribution of the human blood groups and other polymorphisms: Supplement 1. Oxford, UK: Oxford University Press; 1983. [Google Scholar] |
| 7. | Piazza A, Menozzi P, Cavalli-Sforza L. The Making and Testing of Geographic Gene-Frequency Maps. Biometrics. 1981;37:635-659. [Google Scholar] [CrossRef] |
| 8. | Princeton University Press Staff. A Century in Books: Princeton University Press 1905-2005. Princeton, USA: Princeton University Press; 2005. [Google Scholar] |
| 9. | Bowcock AM, Ruiz-Linares A, Tomfohrde J, Minch E, Kidd JR, Cavalli-Sforza LL. High resolution of human evolutionary trees with polymorphic microsatellites. Nature. 1994;368:455-457. [Google Scholar] [CrossRef] |
| 10. | Herrnstein RJ, Murray CA. The bell curve: Intelligence and class structure in American life. Los Angeles, USA: Free Press; 1996. [Google Scholar] |
| 11. | Reich D. Who We Are and How We Got Here. Oxford, UK: Oxford University Press; 2018. [Google Scholar] |

![]()
Copyright © 2026 Pivot Science Publications Corp. - unless otherwise stated | Terms and Conditions | Privacy Policy


